Avon 2004 Annual Report Download - page 40
Download and view the complete annual report
Please find page 40 of the 2004 Avon annual report below. You can navigate through the pages in the report by either clicking on the pages listed below, or by using the keyword search tool below to find specific information within the annual report.-
 1
1 -
2
-
3
-
4
-
5
-
6
-
7
-
8
-
9
-
10
-
11
-
12
-
13
-
14
-
15
-
16
-
17
-
18
-
19
-
20
-
21
-
22
-
23
-
24
-
25
-
26
-
27
-
28
-
29
-
 30
30 -
 31
31 -
 32
32 -
 33
33 -
 34
34 -
 35
35 -
 36
36 -
 37
37 -
 38
38 -
 39
39 -
 40
40 -
 41
41 -
 42
42 -
 43
43 -
 44
44 -
 45
45 -
 46
46 -
 47
47 -
 48
48 -
 49
49 -
 50
50 -
51
-
52
-
53
-
54
-
55
-
56
-
57
-
58
-
59
-
60
-
61
-
62
-
63
-
64
-
65
-
66
-
67
-
68
-
69
-
70
-
71
-
72
-
73
-
74
 |
 |

Global Beauty 61
Notes to Consolidated
Financial Statements
credit for various trade activities and commercial com-
mitments executed in the ordinary course of business,
such as purchase orders for normal replenishment of
inventory levels.
The indentures under which the above notes were
issued contain certain covenants, including limits on
the incurrence of liens and restrictions on the incur-
rence of sale/leaseback transactions and transactions
involving a merger, consolidation or sale of substan-
tially all of Avon’s assets. At December 31, 2004, Avon
was in compliance with all covenants in its indentures.
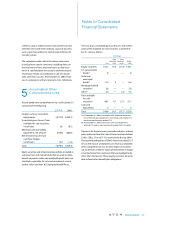
5Accumulated Other
Comprehensive Loss
Accumulated other comprehensive loss at December 31
consisted of the following:
2004 2003
Foreign currency translation
adjustments $(317.0) $(433.5)
Unrealized gains (losses) from
available-for-sale securities,
net of taxes 2.0 (8.5)
Minimum pension liability
adjustment, net of taxes (359.8) (285.8)
Net derivative losses from
cash flow hedges,
net of taxes (4.7) (1.6)
Total $(679.5) $(729.4)
Equity securities and a fixed-income portfolio included in
a grantor trust and mutual funds that are used to make
benefit payments under non-qualified benefit plans are
classified as available-for-sale and recorded at current
market value (see Note 10, Employee Benefit Plans).
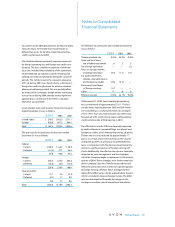
The cost, gross unrealized gains and losses and market
value of the available-for-sale securities as of Decem-
ber 31, were as follows:
2004
Gross Gross
Unrealized Unrealized Market
Cost Gains Losses Value
Equity securities $31.1 $4.4 $(1.4) $34.1
U.S. government
bonds(a) .8—— .8
State and
municipal
bonds(a) 11.3 .3 — 11.6
Mortgage backed
securities(a) 2.0 — — 2.0
Other(a) 3.5 — (.3) 3.2
Total available-
for-sale
securities(b) 48.7 4.7 (1.7) 51.7
Cash and
equivalents .3 — — .3
Total $49.0 $4.7 $(1.7) $52.0
(a) At December 31, 2004, investments with scheduled maturities
in less than two years totaled $2.1, two- to five-years totaled $7.2
and more than five years totaled $5.2.
(b) At December 31, 2004, investments with unrealized losses
totaling $1.4 were in a loss position for greater than 12 months.
Payments for the purchases, proceeds and gross realized
gains and losses from the sales of these securities totaled
$20.0, $28.6, $.4 and $13.9, respectively, during 2004.
During the fourth quarter of 2004, Avon reclassified $13.7
($12.2 after tax) of unrealized losses from accumulated
other comprehensive loss to other expense (income),
net, for declines in the fair values of investments in equity
securities below their cost bases that were judged to be
other-than-temporary. These equity securities are avail-
able to fund select benefit plan obligations.