Avon 2004 Annual Report Download - page 18
Download and view the complete annual report
Please find page 18 of the 2004 Avon annual report below. You can navigate through the pages in the report by either clicking on the pages listed below, or by using the keyword search tool below to find specific information within the annual report.-
 1
1 -
2
-
3
-
4
-
5
-
6
-
7
-
 8
8 -
 9
9 -
 10
10 -
 11
11 -
 12
12 -
 13
13 -
 14
14 -
 15
15 -
 16
16 -
 17
17 -
 18
18 -
 19
19 -
 20
20 -
 21
21 -
 22
22 -
 23
23 -
 24
24 -
 25
25 -
 26
26 -
 27
27 -
 28
28 -
29
-
30
-
31
-
32
-
33
-
34
-
35
-
36
-
37
-
38
-
39
-
40
-
41
-
42
-
43
-
44
-
45
-
46
-
47
-
48
-
49
-
50
-
51
-
52
-
53
-
54
-
55
-
56
-
57
-
58
-
59
-
60
-
61
-
62
-
63
-
64
-
65
-
66
-
67
-
68
-
69
-
70
-
71
-
72
-
73
-
74
 |
 |

Management’s Discussion and
Analysis of Financial Condition
and Results of Operations
In February 2003, the Venezuelan government imple-
mented exchange controls and fixed the exchange rate
for the Venezuelan bolivar (“VEB”) at 1598 per U.S. dollar.
In February 2004, the Venezuelan government devalued
the official exchange rate from 1598 to 1918 VEB for
one U.S. dollar where it remained throughout 2004.
Venezuela’s political and economic situation continues to
limit the ability of Avon’s subsidiary in Venezuela (“Avon
Venezuela”) to conduct normal business operations and
to obtain foreign currency to pay for imported products.
The lack of foreign currency has required Avon Venezuela
to rely on parent company support in order to continue
importing a portion of its material for its operations. Avon
Venezuela’s results of operations in U.S. dollars have
been and are expected to continue to be negatively
impacted until foreign currency is made readily avail-
able to importers. In spite of the difficulty in obtaining
foreign currency for imports, in 2004 and 2003, Avon
Venezuela remitted dividends and royalties to its parent
company at the official exchange rate.
From January 1, 2003, until the February 2004 devaluation,
Avon used the official rate of 1598 VEB for one U.S. dollar to
translate the financial statements of Avon Venezuela into
U.S. dollars. Since then, Avon has used the official rate of
1918 VEB per U.S. dollar to translate the financial state-
ments. In 2004, Avon Venezuela’s net sales and operating
profit represented approximately 2% and 4% of consoli-
dated net sales and consolidated operating profit, respec-
tively. Should a devaluation of the Venezuelan bolivar
occur in 2005, Avon Venezuela’s 2005 results from opera-
tions in U.S. dollars may be negatively impacted.
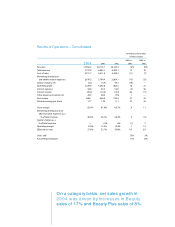
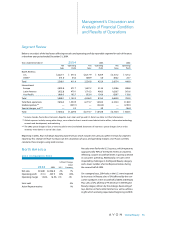
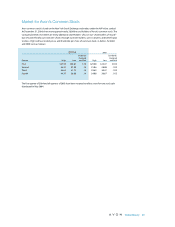
2003 Compared to 2002
%/Point Change
Local
2003 2002 US $ Currency
Net sales $1,716.3 $1,626.7 6% 15%
Operating profit 406.3 361.6 12% 21%
Operating margin 23.7% 22.2% 1.5 1.5
Units sold 2%
Active Representatives 12%
Net sales increased in U.S. dollars and local currencies in
2003 most significantly in the following markets:
• In Argentina, net sales in U.S. dollars and local currency
increased substantially, primarily driven by significant
growth in active Representatives and successful new
product launches.
• In Brazil, net sales in U.S. dollars and local currency
increased, reflecting growth in active Representa-
tives and a shift in product mix towards higher priced
products. Although local currency sales increased,
units declined due to the shift in product mix
towards higher priced products.
• In Mexico, net sales increased in U.S. dollars and
local currency, benefiting from growth in active
Representatives, and new product launches, and
sales promotion offers.
• In Venezuela, net sales increased in U.S. dollars and local
currency driven by growth in active Representatives
and units, and Avon’s ability to provide good service to
its Representatives despite external factors such as the
national strike that lasted until February 2003 and the
exchange rate control imposed by the Venezuelan
government in February 2003.
The increase in operating margin in Latin America in 2003
was most significantly impacted by the following markets:
• In Mexico, operating margin increased (which
increased segment margin by 1.3 points) due to a
lower expense ratio, reflecting savings associated
with Business Transformation initiatives, including a
gain from the sale of property in Mexico City, as the
Company transitioned to a new distribution center in
Celaya, partially offset by an increase in consumer
and strategic investments. Operating margin also
benefited from an improvement in gross margin
resulting from the introduction of products with
higher margins, a favorable mix of products sold,
and savings associated with supply chain Business
Transformation initiatives.
• In Argentina, operating margin increased (which
increased segment margin by .5 point) primarily due
to an improvement in the expense ratio driven by a
significant increase in local currency sales and lower
logistics costs. Additionally, gross margin improved
due to pricing strategies and savings associated with
supply chain Business Transformation initiatives.
• In Venezuela, operating margin increased (which
increased segment margin by .1 point) due to an
increase in gross margin resulting from pricing strate-
gies, a favorable mix of products sold and supply chain
savings related to Business Transformation initiatives.
• In Brazil, operating margin decreased (which
decreased segment margin by .5 point) primarily due
to an increase in the expense ratio resulting from over-
head under absorption due to a unit shortfall, which
more than offset the growth in gross margin resulting
from the sale of higher priced Beauty products.
Global Beauty 39