Avon 2004 Annual Report Download - page 2
Download and view the complete annual report
Please find page 2 of the 2004 Avon annual report below. You can navigate through the pages in the report by either clicking on the pages listed below, or by using the keyword search tool below to find specific information within the annual report.-
 1
1 -
 2
2 -
 3
3 -
 4
4 -
 5
5 -
 6
6 -
 7
7 -
 8
8 -
 9
9 -
 10
10 -
 11
11 -
 12
12 -
 13
13 -
14
-
15
-
16
-
17
-
18
-
19
-
20
-
21
-
22
-
23
-
24
-
25
-
26
-
27
-
28
-
29
-
30
-
31
-
32
-
33
-
34
-
35
-
36
-
37
-
38
-
39
-
40
-
41
-
42
-
43
-
44
-
45
-
46
-
47
-
48
-
49
-
50
-
51
-
52
-
53
-
54
-
55
-
56
-
57
-
58
-
59
-
60
-
61
-
62
-
63
-
64
-
65
-
66
-
67
-
68
-
69
-
70
-
71
-
72
-
73
-
74
 |
 |

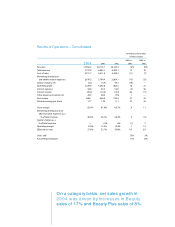
Global Beauty 23
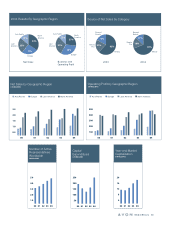
Net Sales Business Unit
Operating Profit
2004 Results By Geographic Region
34%
25%
14%
27%
27%
31%
12%
30%
North
America
North
America
Latin
America Latin
America
Europe Europe
Asia Pacific Asia Pacific
2000 2004
Source of Net Sales by Category
62%
17%
21%
Beauty
Beauty
Plus
Beauty
Plus
69%
13%
18%
Beauty
Beyond
Beauty
Beyond
Beauty
Number of Active
Representatives
Worldwide
IN MILLIONS
5.0
4.0
3.0
2.0
1.0
00 01 02 03 04
Capital
Expenditures
$ IN MILLIONS
250
200
150
100
50
00 01 02 03 04
Year-end Market
Capitalization
$ IN BILLIONS
20
16
12
8
4
00 01 02 03 04
500
400
300
200
100
Asia Pacific Europe Latin America North America
03020100 04
Operating Profit by Geographic Region
$ IN MILLIONS
2.5
2.0
1.5
1.0
0.5
Asia Pacific Europe Latin America North America
03020100 04
Net Sales by Geographic Region
$ IN BILLIONS