Avon 2004 Annual Report Download - page 11
Download and view the complete annual report
Please find page 11 of the 2004 Avon annual report below. You can navigate through the pages in the report by either clicking on the pages listed below, or by using the keyword search tool below to find specific information within the annual report.-
 1
1 -
 2
2 -
 3
3 -
 4
4 -
 5
5 -
 6
6 -
 7
7 -
 8
8 -
 9
9 -
 10
10 -
 11
11 -
 12
12 -
 13
13 -
 14
14 -
 15
15 -
 16
16 -
 17
17 -
 18
18 -
 19
19 -
 20
20 -
 21
21 -
 22
22 -
23
-
24
-
25
-
26
-
27
-
28
-
29
-
30
-
31
-
32
-
33
-
34
-
35
-
36
-
37
-
38
-
39
-
40
-
41
-
42
-
43
-
44
-
45
-
46
-
47
-
48
-
49
-
50
-
51
-
52
-
53
-
54
-
55
-
56
-
57
-
58
-
59
-
60
-
61
-
62
-
63
-
64
-
65
-
66
-
67
-
68
-
69
-
70
-
71
-
72
-
73
-
74
 |
 |

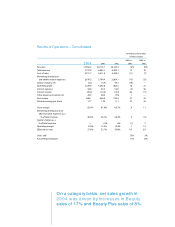
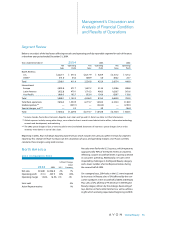
increased the consolidated ratio by .1 point). The expense
ratio in Latin America was flat. Additionally, the consoli-
dated expense ratio was negatively impacted by greater
contributions from markets with higher expense ratios
(which increased the consolidated ratio by .1 point).
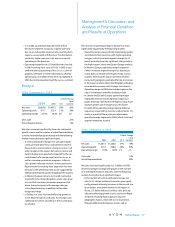
Marketing, distribution and administrative expenses
increased $330.3 in 2003 primarily due to the following:
• a 10% sales increase (which resulted in an increase in
expenses of approximately $162.0),
• an increase in consumer and strategic investments of
$94.0 (including spending on brochures and Sales
Leadership),
• an increase in various other marketing expenses
(including direct marketing, customer access and
promotional literature) of $58.2,
• higher customer service costs in the U.S. of approxi-
mately $25.0,
• merit salary increases of approximately $24.0 for
certain marketing, distribution and administrative
personnel around the world,
• an increase in domestic pension expense of approxi-
mately $23.0,
• expenses of $19.5 related to Avon’s Turkish subsidiary
which was consolidated beginning in the second
quarter of 2003 (see Note 17, Acquisitions), and
• costs of $10.5 (severance and asset write-downs)
associated with the repositioning of the beComing
line of products (see Note 16, Other Information).
These increases in expenses were partially offset by
incremental net savings from workforce reduction pro-
grams associated with Avon’s Business Transformation
initiatives of approximately $85.0 and lower bonus
accruals of approximately $32.0.
As a percentage of total revenue, marketing, distribution
and administrative expenses increased in 2003 due to
higher expense ratios in North America (1.4 points,
which increased the consolidated ratio by .6 point) and
the Asia Pacific (1.2 points, which increased the consoli-
dated ratio by .2 point), partially offset by lower expense
ratios in Europe (.9 point, which reduced the consoli-
dated ratio by .2 point) and Latin America (.3 point,
which reduced the consolidated ratio by .1 point).
See the “Segment Review”section of Management’s Dis-
cussion and Analysis of Financial Condition and Results
of Operations for additional information related to
changes in expense ratios by segment.
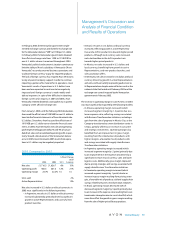
Other Expenses
Interest expense increased slightly in 2004 as a result of
interest on a tax-related liability in Latin America, partially
offset by a decrease in debt-related interest. The decrease
in debt-related interest was primarily due to the retire-
ment of $447.2 of convertible notes in July 2003, par-
tially offset by the issuance of $250.0 of fixed-rate debt
that was later swapped to a floating interest rate. As of
December 31, 2004, Avon had converted approximately
70% of its debt to a floating rate based on LIBOR (see
Note 7, Financial Instruments and Risk Management).
Interest expense decreased in 2003 primarily as a result
of Avon having interest rate swaps at December 31, 2003,
that converted approximately 90% of its debt to a floating
rate based on LIBOR (see Note 7, Financial Instruments
and Risk Management) during a period of declining rates.
In 2003, the lower interest expense was also driven by
lower average debt balances than in 2002.
Interest income increased in 2004, primarily due to
higher average cash and cash equivalents balances
invested offshore at higher interest rates during 2004.
Interest income decreased in 2003, primarily due to
lower average cash and cash equivalents balances dur-
ing 2003 than 2002.
The cash management and tax strategies,
which Avon began implementing during the
second quarter of 2004, are expected to
result in cash management efficiencies and
ongoing tax savings. Avon estimates the
potential effective tax rate for 2005 to be
in the range of 31%.