Avon 2004 Annual Report Download - page 47
Download and view the complete annual report
Please find page 47 of the 2004 Avon annual report below. You can navigate through the pages in the report by either clicking on the pages listed below, or by using the keyword search tool below to find specific information within the annual report.-
 1
1 -
2
-
3
-
4
-
5
-
6
-
7
-
8
-
9
-
10
-
11
-
12
-
13
-
14
-
15
-
16
-
17
-
18
-
19
-
20
-
21
-
22
-
23
-
24
-
25
-
26
-
27
-
28
-
29
-
30
-
31
-
32
-
33
-
34
-
35
-
36
-
 37
37 -
 38
38 -
 39
39 -
 40
40 -
 41
41 -
 42
42 -
 43
43 -
 44
44 -
 45
45 -
 46
46 -
 47
47 -
 48
48 -
 49
49 -
 50
50 -
 51
51 -
 52
52 -
 53
53 -
 54
54 -
 55
55 -
 56
56 -
 57
57 -
58
-
59
-
60
-
61
-
62
-
63
-
64
-
65
-
66
-
67
-
68
-
69
-
70
-
71
-
72
-
73
-
74
 |
 |

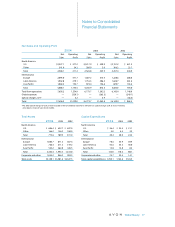
Stock Options
Under the 2000 Plan, stock options are awarded annually and generally vest in thirds over the three-year period follow-
ing each option grant date. Stock options are granted at a price no less than fair market value on the date the option is
granted and have a term of 10 years from the date of grant.
A summary of the Company’s stock option activity, weighted-average exercise price and related information for the
years ended December 31 is as follows:
2004 2003 2002
Weighted- Weighted- Weighted-
Shares Average Shares Average Shares Average
(in 000’s) Price (in 000’s) Price (in 000’s) Price
Outstanding – beginning of year 21,216 $22.52 22,686 $20.58 21,102 $18.17
Granted 5,329 36.64 4,930 26.52 5,718 26.48
Exercised (Note 9) (6,035) 20.25 (5,364) 18.72 (3,992) 16.22
Forfeited (314) 27.26 (1,036) 18.64 (142) 22.46
Outstanding – end of year 20,196 $26.85 21,216 $22.52 22,686 $20.58
Options exercisable – end of year 10,318 $21.96 11,408 $19.79 11,292 $17.74
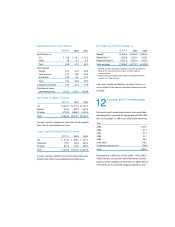
The following table summarizes information about stock options outstanding at December 31, 2004:
Options Outstanding Options Exercisable
Shares Average Average Shares Average
Exercise Prices (in 000’s) Price Term (in 000’s) Price
$ 6.56 – $11.03 75 $ 9.56 1 year 75 $ 9.56
$14.81 – $19.96 3,517 18.04 4 years 3,517 18.04
$20.08 – $24.89 3,070 21.26 6 years 3,050 21.24
$25.69 – $33.08 8,297 26.61 8 years 3,676 26.57
$36.43 – $41.32 5,237 36.68 9 years — —
20,196 10,318
Restricted Stock and Restricted Stock Units
During 2004, 2003 and 2002, restricted stock and
restricted stock units with aggregate value and vesting
periods were granted to employees as follows: 2004 –
616,500 shares or units valued at $21.3, generally vest-
ing over three years; 2003 – 220,500 shares or units
valued at $5.7, generally vesting over three years; and
2002 – 158,600 shares or units valued at $4.2, generally
vesting over three years.
Compensation expense related to grants of restricted
stock or restricted stock units to employees was $8.6 in
2004 (2003 – $6.4; 2002 – $6.6). The unamortized cost
of restricted stock and restricted stock units as of
December 31, 2004, was $17.2 (2003 – $4.7) and was
included in additional paid-in capital.