Avon 2004 Annual Report Download - page 5
Download and view the complete annual report
Please find page 5 of the 2004 Avon annual report below. You can navigate through the pages in the report by either clicking on the pages listed below, or by using the keyword search tool below to find specific information within the annual report.-
 1
1 -
 2
2 -
 3
3 -
 4
4 -
 5
5 -
 6
6 -
 7
7 -
 8
8 -
 9
9 -
 10
10 -
 11
11 -
 12
12 -
 13
13 -
 14
14 -
 15
15 -
 16
16 -
17
-
18
-
19
-
20
-
21
-
22
-
23
-
24
-
25
-
26
-
27
-
28
-
29
-
30
-
31
-
32
-
33
-
34
-
35
-
36
-
37
-
38
-
39
-
40
-
41
-
42
-
43
-
44
-
45
-
46
-
47
-
48
-
49
-
50
-
51
-
52
-
53
-
54
-
55
-
56
-
57
-
58
-
59
-
60
-
61
-
62
-
63
-
64
-
65
-
66
-
67
-
68
-
69
-
70
-
71
-
72
-
73
-
74
 |
 |

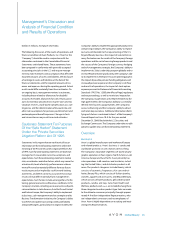
Avon’s diversified global portfolio of markets has
demonstrated that the effects of weak economies
and currency fluctuations in certain countries may
be offset by strong results in others.
Because Avon operates in international regions, fluctu-
ations in the value of foreign currencies cause U.S. dol-
lar-translated amounts to change in comparison with
previous periods. Avon’s diversified global portfolio of
markets has demonstrated that the effects of weak
economies and currency fluctuations in certain coun-
tries may be offset by strong results in others. Actions
which may mitigate currency risk include strategies such
as hedging of certain currencies, and local manufacturing
and sourcing in certain countries to limit risk associated
with possible increases in the cost of imported goods.
Avon cannot, however, project the possible effect of cur-
rency fluctuations upon its results when translated into
U.S. dollars or on its future earnings.
Strategic Initiatives
The Company’s strategic initiatives include a focus on
Beauty brands as a key driver of sales growth, as well as
new product lines such as Health and Wellness prod-
ucts and mark. Growth is also targeted from further
expansion of Sales Leadership, a career opportunity for
Avon Representatives, as well as exploration of geo-
graphic opportunities, in particular, China, Central
and Eastern Europe, Turkey and the Middle East, and the
Andean region of South America. In addition, the Com-
pany expects that its Business Transformation programs
will continue to produce margin expansion, primarily as
a result of savings from supply chain and marketing ini-
tiatives, which will also fuel continued incremental con-
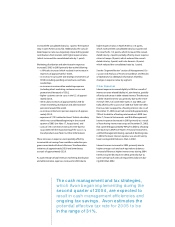
sumer and strategic investments. In 2004, Avon’s Board
approved the development of an integrated global sup-
ply chain strategy, which includes development of a
new common systems platform, known as enterprise
resource planning (“ERP”). The ERP system is expected
to drive global integration of the Company’s operations
and improve the speed,
flexibility and efficiency of its global supply chain. The
global supply chain strategy is essential to the achieve-
ment of Avon’s accelerated growth and operating mar-
gin targets. Implementation is scheduled to start in
Europe in early 2005. Avon anticipates that the ERP
project will be substantially complete in 2008. Capital
investment and expense associated with the imple-
mentation of the ERP project are estimated to be in the
ranges of $125.0 to $135.0 and $75.0 to $90.0, respec-
tively, during the period 2005 through 2008, and will
be subject to further review and approval by Avon’s
Board of Directors.
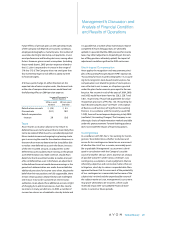
Key Performance Indicators
Within the following discussion and analysis, Avon utilizes the key performance indicators (“KPIs”) defined below to
assist in the evaluation of its business.
KPI Definition
Change in Active Representatives This indicator is based on the number of Representatives submitting
an order in a campaign, totaled for all campaigns in the related
period. This amount is divided by the number of billing days in the
associated period, to exclude the impact of year-to-year changes in
billing days (for example, holiday schedules). To determine the
Change in Active Representatives, this calculation is compared to
the same calculation in the corresponding period of the prior year.
Change in Units The gross number of pieces of merchandise sold during a period, as
compared to the same number in the same period of the prior year.
Units sold include samples sold and product contingent upon the
purchase of another product (for example, gift with purchase or
purchase with purchase), but exclude free samples.
Accounts Receivable Days The number of days of preceding months’net sales covered by the
accounts receivable balance at the end of the period.
Inventory Days The number of days of estimated future months’cost of sales cov-
ered by the inventory balance at the end of the period.
Accounts Payable Days The number of days of preceding months’cost of sales covered by
the accounts payable balance at the end of the period.