Avon 2004 Annual Report Download - page 19
Download and view the complete annual report
Please find page 19 of the 2004 Avon annual report below. You can navigate through the pages in the report by either clicking on the pages listed below, or by using the keyword search tool below to find specific information within the annual report.-
 1
1 -
2
-
3
-
4
-
5
-
6
-
7
-
8
-
 9
9 -
 10
10 -
 11
11 -
 12
12 -
 13
13 -
 14
14 -
 15
15 -
 16
16 -
 17
17 -
 18
18 -
 19
19 -
 20
20 -
 21
21 -
 22
22 -
 23
23 -
 24
24 -
 25
25 -
 26
26 -
 27
27 -
 28
28 -
 29
29 -
30
-
31
-
32
-
33
-
34
-
35
-
36
-
37
-
38
-
39
-
40
-
41
-
42
-
43
-
44
-
45
-
46
-
47
-
48
-
49
-
50
-
51
-
52
-
53
-
54
-
55
-
56
-
57
-
58
-
59
-
60
-
61
-
62
-
63
-
64
-
65
-
66
-
67
-
68
-
69
-
70
-
71
-
72
-
73
-
74
 |
 |

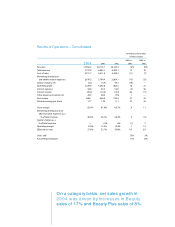
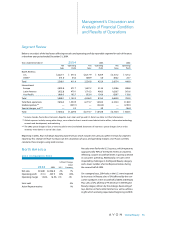
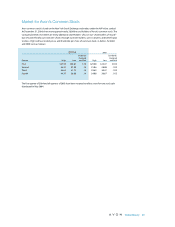
Asia Pacific
2004 Compared to 2003
%/Point Change
Local
2004 2003 US $ Currency
Net sales $1,060.3 $ 923.4 15% 11%
Operating profit 192.7 156.6 23% 19%
Operating margin 17.9% 16.7% 1.2 1.2
Units sold 21%
Active Representatives 13%
Net sales in U.S. dollars increased as a result of growth in
nearly all markets in the region, reflecting increases in units
and active Representatives, as well as the favorable impact
of foreign exchange. The growth in active Representatives
was partially due to an increase in the number of sales
campaigns in the Philippines beginning in the second
quarter of 2004, which resulted in additional opportunities
to order and increased the active Representative growth
rate in the region by 5%.
• In China, net sales increased primarily due to growth
in units driven by advertising and consumer promo-
tion programs, as well as growth in the number of
and increased activity at the Beauty Boutiques.
• In Australia and Taiwan, net sales increased primarily
due to growth in active Representatives as well as
favorable foreign exchange.
• In Malaysia, net sales increased mainly due to bene-
fits associated with the 2003 reorganization of sales
branches in that country.
The increase in operating margin in Asia Pacific was
most significantly impacted by the following markets:
• In China, operating margin improved (which increased
segment margin by .6 point) reflecting a higher gross
margin benefiting from savings associated with supply
chain Business Transformation initiatives.
• In Malaysia, operating margin improved (which
increased segment margin by .5 point) primarily due
to benefits associated with the 2003 reorganization of
sales branches in that country and the resulting lever-
age achieved from this reorganization.
• In Australia, operating margin improved (which
increased segment margin by .5 point) primarily
due to a higher gross margin, reflecting favorable
foreign exchange on inventory purchases.
• In Japan, operating margin improved (which increased
segment margin by .4 point) resulting primarily from
an increase in gross margin driven by savings associ-
ated with supply chain Business Transformation initia-
tives, partially offset by higher expenses associated
with customer acquisition programs.
In addition, expenses in the region included strategic
investments in organization capacity (which decreased
segment margin by 1.0 point).
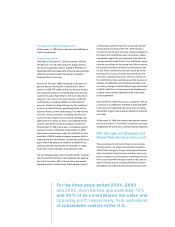
The Company anticipates the resumption of direct selling
activities in some form in China, pending government
approval. Direct selling was banned by the Chinese gov-
ernment in 1998. The Company believes that a resump-
tion of direct selling will have a positive impact on its
results of operations on a long-term basis.
Avon has operations in four of the countries (India,
Indonesia, Malaysia and Thailand) that were affected
by the December 2004 earthquake and tsunami in
Southeast Asia. The earthquake and tsunami did not
have a material impact on property or 2004 operating
profit, and are not expected to have a material impact
on 2005 operating profit.
Avon anticipates the resumption of direct
selling activities in some form in China,
pending government approval.