Avon 2004 Annual Report Download - page 55
Download and view the complete annual report
Please find page 55 of the 2004 Avon annual report below. You can navigate through the pages in the report by either clicking on the pages listed below, or by using the keyword search tool below to find specific information within the annual report.-
 1
1 -
2
-
3
-
4
-
5
-
6
-
7
-
8
-
9
-
10
-
11
-
12
-
13
-
14
-
15
-
16
-
17
-
18
-
19
-
20
-
21
-
22
-
23
-
24
-
25
-
26
-
27
-
28
-
29
-
30
-
31
-
32
-
33
-
34
-
35
-
36
-
37
-
38
-
39
-
40
-
41
-
42
-
43
-
44
-
 45
45 -
 46
46 -
 47
47 -
 48
48 -
 49
49 -
 50
50 -
 51
51 -
 52
52 -
 53
53 -
 54
54 -
 55
55 -
 56
56 -
 57
57 -
 58
58 -
 59
59 -
 60
60 -
 61
61 -
 62
62 -
 63
63 -
 64
64 -
 65
65 -
66
-
67
-
68
-
69
-
70
-
71
-
72
-
73
-
74
 |
 |

Additionally, Avon held assets at December 31, 2004
and 2003, amounting to $34.2 and $22.5, respectively,
that may be used for other benefit payments. At
December 31, 2004 and 2003, the assets consisted of
corporate-owned life insurance policies with cash sur-
render values of $31.9 and $20.3, respectively, and
mutual funds with market values of $2.3 and $2.2,
respectively. The assets are recorded at market value,
with increases or decreases in the corporate-owned
life insurance policies reflected in the Consolidated
Statements of Income.
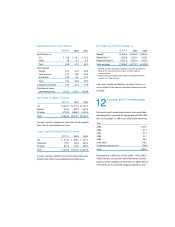
Postretirement Benefits
For 2005, the assumed rate of future increases in the
per capita cost of health care benefits (the health care
cost trend rate) was 10.0% for all claims and will grad-
ually decrease each year thereafter to 5.0% in 2010
and beyond. A one-percentage point change in the
assumed health care cost trend rates would have the
following effects:
1 Percentage 1 Percentage
(In millions) Point Increase Point Decrease
Effect on total
of service and
interest cost
components $ .1 $ (.1)
Effect on
postretirement
benefit obligation 1.7 (1.7)
Postemployment Benefits
Avon provides postemployment benefits, which
include salary continuation, severance benefits, disabil-
ity benefits, continuation of health care benefits and life
insurance coverage to eligible former employees after
employment but before retirement. At December 31,
2004 and 2003, the accrued cost for postemployment
benefits was $45.0 and $42.8, respectively, and was
included in employee benefit plans.
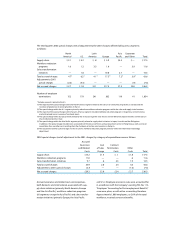
11 Segment Information
The Company’s operating segments, which are its
reportable segments, are based on geographic opera-
tions and include operating business units in North
America, Europe, Latin America, and the Asia Pacific.
The segments have similar business characteristics and
each offers similar products through similar customer
access methods.
The accounting policies of the segments are the same
as those described in Note 1, Description of the Business
and Summary of Significant Accounting Policies. The
Company evaluates the performance of its segments
based on operating profits or losses. Segment revenues
reflect direct sales of products to Representatives
based on the Representative’s geographic location.
Intersegment sales and transfers are not significant. Each
segment records direct expenses related to its employ-
ees and its operations. The Company does not allocate
income taxes, foreign exchange gains or losses, or cor-
porate global expenses to segments. Global expenses
include, among other things, costs related to Avon’s
executive and administrative offices, information tech-
nology, research and development, and marketing.
Summarized financial information concerning Avon’s
reportable segments as of December 31 is shown in
the following tables. North America – Other includes
Canada, Puerto Rico, the Dominican Republic, Avon
Salon and Spa and U.S. Retail.