Avon 2004 Annual Report Download - page 46
Download and view the complete annual report
Please find page 46 of the 2004 Avon annual report below. You can navigate through the pages in the report by either clicking on the pages listed below, or by using the keyword search tool below to find specific information within the annual report.-
 1
1 -
2
-
3
-
4
-
5
-
6
-
7
-
8
-
9
-
10
-
11
-
12
-
13
-
14
-
15
-
16
-
17
-
18
-
19
-
20
-
21
-
22
-
23
-
24
-
25
-
26
-
27
-
28
-
29
-
30
-
31
-
32
-
33
-
34
-
35
-
 36
36 -
 37
37 -
 38
38 -
 39
39 -
 40
40 -
 41
41 -
 42
42 -
 43
43 -
 44
44 -
 45
45 -
 46
46 -
 47
47 -
 48
48 -
 49
49 -
 50
50 -
 51
51 -
 52
52 -
 53
53 -
 54
54 -
 55
55 -
 56
56 -
57
-
58
-
59
-
60
-
61
-
62
-
63
-
64
-
65
-
66
-
67
-
68
-
69
-
70
-
71
-
72
-
73
-
74
 |
 |

Global Beauty 67
Notes to Consolidated
Financial Statements
be exposed to market risk on the underlying items
being hedged as a result of changes in foreign exchange
and interest rates.
Fair Value of Financial Instruments
The fair value of a financial instrument is the amount at
which the instrument could be exchanged in a current
transaction between willing parties, other than in a
forced sale or liquidation.
The methods and assumptions used to estimate fair
value are as follows:
Equity and fixed-income securities – The fair values of
these investments were based on the quoted market
prices for issues listed on securities exchanges.
Debt maturing within one year and long-term debt –
The fair values of all debt and other financing were
determined based on quoted market prices.
Foreign exchange forward and option contracts –
The fair values of forward and option contracts were
determined based on quoted market prices from banks.
Interest rate swap agreements – The fair values of interest
rate swap agreements were estimated based on quotes
from market makers of these instruments and represent
the estimated amounts that Avon would expect to
receive or pay to terminate the agreements.
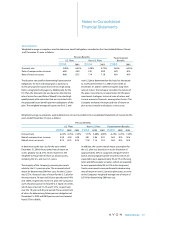
The asset (liability) amounts recorded in the balance
sheet (carrying amount) and the estimated fair values
of financial instruments at December 31 consisted of
the following:
2004 2003
Carrying Fair Carrying Fair
Amount Value Amount Value
Cash and cash
equivalents $ 769.6 $ 769.6 $ 694.0 $ 694.0
Equity securities 34.1 34.1 30.8 30.8
Fixed-income
securities 17.9 17.9 27.1 27.1
Debt maturing
within one year (51.7) (51.7) (244.1) (253.4)
Long-term debt, net
of related discount
or premium (865.7) (903.5) (877.0) (898.0)
Foreign exchange
forward and
option contracts 5.0 5.0 2.6 2.6
Interest rate swap
agreements 22.5 22.5 31.1 31.1
Unrealized gains (losses) of $3.0 and $(13.2) on
equity securities were recorded in accumulated
other comprehensive loss at December 31, 2004
and 2003, respectively.
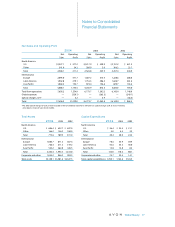
8Long-Term Incentive Plans
The Year 2000 Stock Incentive Plan (the “2000 Plan”)
provides for several types of equity-based incentive
compensation awards including stock options, stock
appreciation rights, restricted stock, restricted stock units
and performance unit awards. Under the 2000 Plan, the
maximum number of shares that may be awarded is
36,500,000 shares, of which no more than 12,000,000
shares may be used for restricted stock awards.