Avon 2004 Annual Report Download - page 10
Download and view the complete annual report
Please find page 10 of the 2004 Avon annual report below. You can navigate through the pages in the report by either clicking on the pages listed below, or by using the keyword search tool below to find specific information within the annual report.-
 1
1 -
 2
2 -
 3
3 -
 4
4 -
 5
5 -
 6
6 -
 7
7 -
 8
8 -
 9
9 -
 10
10 -
 11
11 -
 12
12 -
 13
13 -
 14
14 -
 15
15 -
 16
16 -
 17
17 -
 18
18 -
 19
19 -
 20
20 -
 21
21 -
22
-
23
-
24
-
25
-
26
-
27
-
28
-
29
-
30
-
31
-
32
-
33
-
34
-
35
-
36
-
37
-
38
-
39
-
40
-
41
-
42
-
43
-
44
-
45
-
46
-
47
-
48
-
49
-
50
-
51
-
52
-
53
-
54
-
55
-
56
-
57
-
58
-
59
-
60
-
61
-
62
-
63
-
64
-
65
-
66
-
67
-
68
-
69
-
70
-
71
-
72
-
73
-
74
 |
 |

Management’s Discussion and
Analysis of Financial Condition
and Results of Operations
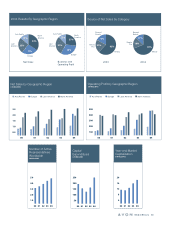
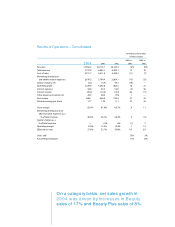
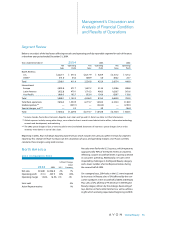
Net Sales
Net sales growth in 2004 was 13%, and was driven by an
increase in units and the number of active Representatives,
with dollar increases in all regions. Excluding the impact
of foreign currency exchange, consolidated net sales
increased 10%, with increases in all regions.
On a category basis, net sales growth in 2004 was driven
by increases in Beauty sales of 17% (with strong increases
in all categories) and Beauty Plus sales of 8%. Beyond
Beauty sales were flat.
Net sales growth in 2003 in dollars and local currency
was 10%, and was driven by an increase in the number
of active Representatives and, to a lesser extent, growth
in units, with increases in all regions. In the second quar-
ter of 2003, Avon began consolidating its Turkish sub-
sidiary which increased sales by $47.2 in 2003.
On a category basis, the 2003 net sales increase was driven
by a 15% increase in Beauty sales (with strong increases in
all categories) and, to a lesser extent, increases in Beyond
Beauty sales of 3% (including a strong increase in Health
and Wellness sales within this category) and Beauty Plus
sales of 2%.
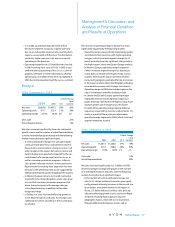
Other Revenue
Other revenue primarily includes shipping and handling
fees billed to Representatives which totaled $91.6, $71.4
and $57.7 in 2004, 2003 and 2002, respectively.
Gross Margin
Gross margin improved .6 point in 2004 due to increases
in Latin America (1.1 points, which increased consoli-
dated gross margin by .3 point), Europe (.7 point, which
increased consolidated gross margin by .2 point) and Asia
Pacific (1.0 points which increased consolidated gross
margin by .2 point), partially offset by a decline in North
America (.8 point, which decreased consolidated gross
margin by .3 point). Additionally, gross margin benefited
from greater contributions from countries with higher
gross margins (which increased consolidated gross mar-
gin by .2 point). The gross margin improvement discussed
previously included incremental net savings associated
primarily with supply chain Business Transformation ini-
tiatives, which favorably impacted consolidated gross
margin by .2 point.
Gross margin improved 1.1 points in 2003, as compared to
2002, due to increases in all regions as follows: Europe
(1.6 points, which increased consolidated gross margin
by .4 point), Latin America (1.1 points which increased
consolidated gross margin by .3 point), Asia Pacific (2.1
points, which increased consolidated gross margin by .3
point) and North America (.1 point, which increased con-
solidated gross margin by less than .1 point). Additionally,
gross margin benefited from greater contributions from
countries with higher gross margins (which increased
consolidated gross margin by .1 point). The gross margin
improvements discussed previously included incremen-
tal net savings associated with supply chain Business
Transformation initiatives across all segments, which
favorably impacted consolidated gross margin by
1.3 points.
See the “Segment Review”section of Management’s Dis-
cussion and Analysis of Financial Condition and Results
of Operations for additional information related to
changes in gross margin by segment.
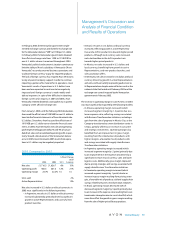
Marketing, Distribution and Administrative
Expenses
Marketing, distribution and administrative expenses
increased $415.9 in 2004 primarily due to the following:
• a 13% sales increase (which resulted in an increase
in expenses of approximately $228.0),
• an increase in consumer and strategic investments
of $104.0 (including Sales Leadership and spending
on brochures),
• an increase in various other marketing expenses of
approximately $56.0 (including public relations,
direct marketing and promotional material),
• merit salary increases of approximately $26.0 for
certain marketing, distribution and administrative
personnel around the world, and
• an increase in U.S. and non-U.S. pension expense
of $10.9.
These increases in expenses were partially offset by incre-
mental net savings from workforce reduction programs
associated with Avon’s Business Transformation initiatives
of approximately $45.0 in 2004 and a favorable compari-
son to 2003, which included costs from severance and
asset write-downs associated with the repositioning of
the beComing line of products of $10.5 in 2003.
As a percentage of total revenue, marketing, distribution
and administrative expenses decreased in 2004 due to
lower expense ratios in Europe (2.3 points, which low-
ered the consolidated ratio by .7 point), and Asia Pacific
(.2 point, which lowered the consolidated ratio by .1
point), partially offset by higher global expenses (which
increased the consolidated ratio by .4 point) and a
higher expense ratio in North America (.1 point, which
Global Beauty 31