American Airlines 2002 Annual Report Download - page 86
Download and view the complete annual report
Please find page 86 of the 2002 American Airlines annual report below. You can navigate through the pages in the report by either clicking on the pages listed below, or by using the keyword search tool below to find specific information within the annual report.
84
16. Segment Reporting (Continued)
Revenues from other segments are below the quantitative threshold for determining reportable segments
and consist primarily of revenues from AMR Investment Services, Inc. and Americas Ground Services, Inc. The
difference between the financial information of the Company’s one reportable segment and the financial
information included in the consolidated statements of operations and balance sheets as a result of these entities
is not material.
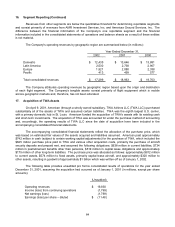
The Company’s operating revenues by geographic region are summarized below (in millions):
Year Ended December 31,
2002 2001 2000
Domestic $ 12,435 $ 13,646 $ 13,881
Latin America 2,530 2,738 2,907
Europe 1,921 2,080 2,338
Pacific 413 499 577
Total consolidated revenues $ 17,299 $ 18,963 $ 19,703
The Company attributes operating revenues by geographic region based upon the origin and destination
of each flight segment. The Company’s tangible assets consist primarily of flight equipment which is mobile
across geographic markets and, therefore, has not been allocated.
17. Acquisition of TWA Assets
On April 9, 2001, American (through a wholly owned subsidiary, TWA Airlines LLC (TWA LLC)) purchased
substantially all of the assets of TWA and assumed certain liabilities. TWA was the eighth largest U.S. carrier,
with a primary domestic hub in St. Louis. American funded the acquisition of TWA’s assets with its existing cash
and short-term investments. The acquisition of TWA was accounted for under the purchase method of accounting
and, accordingly, the operating results of TWA LLC since the date of acquisition have been included in the
accompanying consolidated financial statements.
The accompanying consolidated financial statements reflect the allocation of the purchase price, which
was based on estimated fair values of the assets acquired and liabilities assumed. American paid approximately
$742 million in cash (subject to certain working capital adjustments) for the purchase of TWA, which included the
$625 million purchase price paid to TWA and various other acquisition costs, primarily the purchase of aircraft
security deposits and prepaid rent, and assumed the following obligations: $638 million in current liabilities, $734
million in postretirement benefits other than pensions, $519 million in capital lease obligations and approximately
$175 million of other long-term liabilities. The purchase price was allocated as follows: approximately $812 million
to current assets, $574 million to fixed assets, primarily capital lease aircraft, and approximately $320 million to
other assets, resulting in goodwill of approximately $1 billion which was written-off as of January 1, 2002.
The following table provides unaudited pro forma consolidated results of operations for the year ended
December 31, 2001, assuming the acquisition had occurred as of January 1, 2001 (in millions, except per share
amounts):
(Unaudited)
Operating revenues $ 19,830
Income (loss) from continuing operations (1,769)
Net earnings (loss) (1,769)
Earnings (loss) per share – diluted $ (11.48)


