American Airlines 2002 Annual Report Download - page 77
Download and view the complete annual report
Please find page 77 of the 2002 American Airlines annual report below. You can navigate through the pages in the report by either clicking on the pages listed below, or by using the keyword search tool below to find specific information within the annual report.-
 1
1 -
2
-
3
-
4
-
5
-
6
-
7
-
8
-
9
-
10
-
11
-
12
-
13
-
14
-
15
-
16
-
17
-
18
-
19
-
20
-
21
-
22
-
23
-
24
-
25
-
26
-
27
-
28
-
29
-
30
-
31
-
32
-
33
-
34
-
35
-
36
-
37
-
38
-
39
-
40
-
41
-
42
-
43
-
44
-
45
-
46
-
47
-
48
-
49
-
50
-
51
-
52
-
53
-
54
-
55
-
56
-
57
-
58
-
59
-
60
-
61
-
62
-
63
-
64
-
65
-
66
-
 67
67 -
 68
68 -
 69
69 -
 70
70 -
 71
71 -
 72
72 -
 73
73 -
 74
74 -
 75
75 -
 76
76 -
 77
77 -
 78
78 -
 79
79 -
 80
80 -
 81
81 -
 82
82 -
 83
83 -
 84
84 -
 85
85 -
 86
86 -
 87
87 -
88
-
89
-
90
-
91
-
92
-
93
-
94
-
95
-
96
-
97
-
98
-
99
-
100
-
101
-
102
-
103
-
104
-
105
-
106
-
107
-
108
 |
 |

75
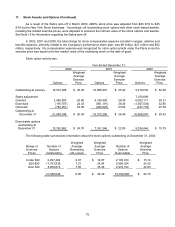
11. Stock Awards and Options (Continued)
As a result of the Sabre spin-off in March 2000, AMR’s stock price was adjusted from $60 9/16 to $25
9/16 by the New York Stock Exchange. Accordingly, all outstanding stock options and other stock-based awards,
including the related exercise prices, were adjusted to preserve the intrinsic value of the stock options and awards.
See Note 15 for information regarding the Sabre spin-off.
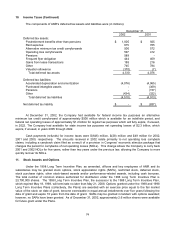
In 2002, 2001 and 2000, the total charge for stock compensation expense included in wages, salaries and
benefits expense, primarily related to the Company’s performance share plan, was $9 million, $21 million and $52
million, respectively. No compensation expense was recognized for stock option grants under the Plans since the
exercise price was equal to the fair market value of the underlying stock on the date of grant.
Stock option activity was:
Year Ended December 31,
2002 2001 2000
Weighted
Average
Weighted
Average
Weighted
Average
Options
Exercise
Price Options
Exercise
Price Options
Exercise
Price
Outstanding at January 19,512,286 $ 26.46 16,568,907 $ 25.42 5,219,634 $ 52.06
Sabre adjustment - - - - 7,150,899 -
Granted 2,495,500 25.86 4,180,595 28.35 6,003,111 30.21
Exercised (176,787) 24.33 (951,191) 38.34 (1,557,034) 32.85
Canceled (782,951) 24.90 (286,025) 23.04 (247,703) 23.38
Outstanding at
December 31 21,048,048 $ 26.49 19,512,286 $ 26.46 16,568,907 $ 25.42
Exercisable options
outstanding at
December 31 10,762,962 $ 24.70 7,161,346 $ 22.95 5,334,444 $ 19.79
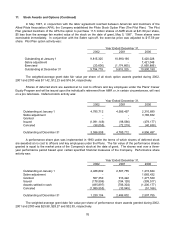
The following table summarizes information about the stock options outstanding at December 31, 2002:
Range of
Exercise
Prices
Number of
Options
Outstanding
Weighted
Average
Remaining
Life (years)
Weighted
Average
Exercise
Price
Number of
Options
Exercisable
Weighted
Average
Exercise
Price
Under $20 2,297,494 2.97 $ 14.87 2,193,914 $ 15.14
$20-$30 11,793,938 7.31 24.64 5,589,324 24.22
Over $30 6,956,616 7.50 33.45 2,979,724 32.63
21,048,048 6.90 $ 26.49 10,762,962 $ 24.70