American Airlines 2002 Annual Report Download - page 101
Download and view the complete annual report
Please find page 101 of the 2002 American Airlines annual report below. You can navigate through the pages in the report by either clicking on the pages listed below, or by using the keyword search tool below to find specific information within the annual report.-
 1
1 -
2
-
3
-
4
-
5
-
6
-
7
-
8
-
9
-
10
-
11
-
12
-
13
-
14
-
15
-
16
-
17
-
18
-
19
-
20
-
21
-
22
-
23
-
24
-
25
-
26
-
27
-
28
-
29
-
30
-
31
-
32
-
33
-
34
-
35
-
36
-
37
-
38
-
39
-
40
-
41
-
42
-
43
-
44
-
45
-
46
-
47
-
48
-
49
-
50
-
51
-
52
-
53
-
54
-
55
-
56
-
57
-
58
-
59
-
60
-
61
-
62
-
63
-
64
-
65
-
66
-
67
-
68
-
69
-
70
-
71
-
72
-
73
-
74
-
75
-
76
-
77
-
78
-
79
-
80
-
81
-
82
-
83
-
84
-
85
-
86
-
87
-
88
-
89
-
90
-
 91
91 -
 92
92 -
 93
93 -
 94
94 -
 95
95 -
 96
96 -
 97
97 -
 98
98 -
 99
99 -
 100
100 -
 101
101 -
 102
102 -
 103
103 -
 104
104 -
 105
105 -
 106
106 -
 107
107 -
 108
108
 |
 |

99
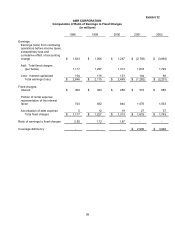
Exhibit 12
AMR CORPORATION
Computation of Ratio of Earnings to Fixed Charges
(in millions)
1998 1999 2000 2001 2002
Earnings:
Earnings (loss) from continuing
operations before income taxes,
extraordinary loss and
cumulative effect of accounting
change $ 1,833 $ 1,006 $ 1,287 $ (2,756) $ (3,860)
Add: Total fixed charges
(per below) 1,117 1,227 1,313 1,618 1,745
Less: Interest capitalized 104 118 151 144 86
Total earnings (loss) $ 2,846 $ 2,115 $ 2,449 $ (1,282) $ (2,201)
Fixed charges:
Interest $ 369 $ 383 $ 450 $ 515 $ 655
Portion of rental expense
representative of the interest
factor 743 832 844 1,076 1,053
Amortization of debt expense 5 12 19 27 37
Total fixed charges $ 1,117 $ 1,227 $ 1,313 $ 1,618 $ 1,745
Ratio of earnings to fixed charges 2.55 1.72 1.87 - -
Coverage deficiency - - - $ 2,900 $ 3,946