American Airlines 2002 Annual Report Download - page 30
Download and view the complete annual report
Please find page 30 of the 2002 American Airlines annual report below. You can navigate through the pages in the report by either clicking on the pages listed below, or by using the keyword search tool below to find specific information within the annual report.-
 1
1 -
2
-
3
-
4
-
5
-
6
-
7
-
8
-
9
-
10
-
11
-
12
-
13
-
14
-
15
-
16
-
17
-
18
-
19
-
 20
20 -
 21
21 -
 22
22 -
 23
23 -
 24
24 -
 25
25 -
 26
26 -
 27
27 -
 28
28 -
 29
29 -
 30
30 -
 31
31 -
 32
32 -
 33
33 -
 34
34 -
 35
35 -
 36
36 -
 37
37 -
 38
38 -
 39
39 -
 40
40 -
41
-
42
-
43
-
44
-
45
-
46
-
47
-
48
-
49
-
50
-
51
-
52
-
53
-
54
-
55
-
56
-
57
-
58
-
59
-
60
-
61
-
62
-
63
-
64
-
65
-
66
-
67
-
68
-
69
-
70
-
71
-
72
-
73
-
74
-
75
-
76
-
77
-
78
-
79
-
80
-
81
-
82
-
83
-
84
-
85
-
86
-
87
-
88
-
89
-
90
-
91
-
92
-
93
-
94
-
95
-
96
-
97
-
98
-
99
-
100
-
101
-
102
-
103
-
104
-
105
-
106
-
107
-
108
 |
 |
28
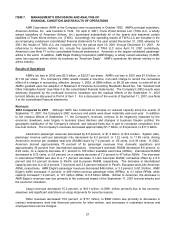
2001 Compared to 2000 The Company’s 2001 revenues, yield, RPMs and ASMs were severely impacted by the
September 11, 2001 terrorist attacks, the Company’s reduced operating schedule, a worsening of the U.S.
economy that had already been dampening the demand for travel both domestically and internationally prior to the
September 11, 2001 events, business travel declines as a result of the September 11, 2001 attacks, and
increased fare sale activity occurring subsequent to the September 11 attacks to encourage passengers to
resume flying. The Company’s revenues decreased approximately $740 million, or 3.8 percent, versus 2000.
However, excluding TWA LLC’s revenues for the period April 10, 2001 through December 31, 2001, the
Company’s revenues would have decreased approximately $2.6 billion versus 2000.
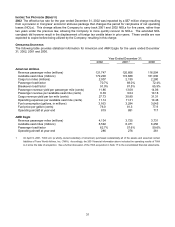
For comparability purposes, the following discussion does not combine American’s and TWA’s results of
operations or related statistics for 2001. American's passenger revenues decreased by 14 percent, or $2.3 billion.
In 2001, American derived approximately 68 percent of its passenger revenues from domestic operations and
approximately 32 percent from international operations. American’s domestic RASM decreased 11.3 percent, to
9.28 cents, on a capacity decrease of 5 percent to 104 billion ASMs. International RASM decreased to 9.07 cents,
or 5.2 percent, on a capacity decrease of 4.9 percent. The decrease in international RASM was led by an 11.8
percent and 10.8 percent decrease in Pacific and European RASM, respectively, slightly offset by a 0.9 percent
increase in Latin American RASM. The decrease in international capacity was driven by a 6.5 percent and 4.7
percent reduction in Latin American and European ASMs, respectively, partially offset by an increase in Pacific
capacity of 2.8 percent.
TWA LLC’s passenger revenues were approximately $1.7 billion for the period April 10, 2001 through
December 31, 2001. TWA LLC’s RASM was 7.74 cents on capacity of 21.7 billion ASMs.
AMR Eagle’s passenger revenues decreased $74 million, or 5.1 percent. AMR Eagle’s traffic remained
flat compared to 2000, at 3.7 billion RPMs, while capacity increased to 6.5 billion ASMs, or 3.4 percent. Similar to
American, the decrease in AMR Eagle’s revenues was due primarily to the September 11, 2001 terrorist attacks
and a worsening of the U.S. economy that had already been dampening the demand for air travel prior to the
events of September 11, 2001.
Cargo revenues decreased 8.2 percent, or $59 million, for the same reasons as noted above.