American Airlines 2002 Annual Report Download - page 33
Download and view the complete annual report
Please find page 33 of the 2002 American Airlines annual report below. You can navigate through the pages in the report by either clicking on the pages listed below, or by using the keyword search tool below to find specific information within the annual report.
31
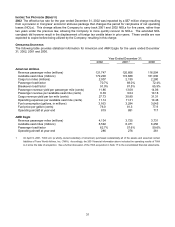
INCOME TAX PROVISION (BENEFIT)
2002 The effective tax rate for the year ended December 31, 2002 was impacted by a $57 million charge resulting
from a provision in Congress’ economic stimulus package that changes the period for carrybacks of net operating
losses (NOLs). This change allows the Company to carry back 2001 and 2002 NOLs for five years, rather than
two years under the previous law, allowing the Company to more quickly recover its NOLs. The extended NOL
carryback did however result in the displacement of foreign tax credits taken in prior years. These credits are now
expected to expire before being utilized by the Company, resulting in this charge.
OPERATING STATISTICS
The following table provides statistical information for American and AMR Eagle for the years ended December
31, 2002, 2001 and 2000.
Year Ended December 31,
2002 200112000
American Airlines
Revenue passenger miles (millions) 121,747 120,606 116,594
Available seat miles (millions) 172,200 174,688 161,030
Cargo ton miles (millions) 2,007 2,130 2,280
Passenger load factor 70.7% 69.0% 72.4%
Breakeven load factor 91.0% 81.5% 65.9%
Passenger revenue yield per passenger mile (cents) 11.86 13.08 14.06
Passenger revenue per available seat mile (cents) 8.39 9.04 10.18
Cargo revenue yield per ton mile (cents) 27.73 30.80 31.31
Operating expenses per available seat mile (cents) 11.14 11.31 10.48
Fuel consumption (gallons, in millions) 3,163 3,294 3,045
Fuel price per gallon (cents) 76.0 81.3 77.9
Operating aircraft at year-end 819 881 717
AMR Eagle
Revenue passenger miles (millions) 4,134 3,725 3,731
Available seat miles (millions) 6,592 6,471 6,256
Passenger load factor 62.7% 57.6% 59.6%
Operating aircraft at year-end 286 276 261
1 On April 9, 2001, TWA LLC (a wholly owned subsidiary of American) purchased substantially all of the assets and assumed certain
liabilities of Trans World Airlines, Inc. (TWA). Accordingly, the 2001 financial information above includes the operating results of TWA
LLC since the date of acquisition. See a further discussion of the TWA acquisition in Note 17 to the consolidated financial statements.


