Abercrombie & Fitch 2011 Annual Report Download - page 90
Download and view the complete annual report
Please find page 90 of the 2011 Abercrombie & Fitch annual report below. You can navigate through the pages in the report by either clicking on the pages listed below, or by using the keyword search tool below to find specific information within the annual report.-
 1
1 -
2
-
3
-
4
-
5
-
6
-
7
-
8
-
9
-
10
-
11
-
12
-
13
-
14
-
15
-
16
-
17
-
18
-
19
-
20
-
21
-
22
-
23
-
24
-
25
-
26
-
27
-
28
-
29
-
30
-
31
-
32
-
33
-
34
-
35
-
36
-
37
-
38
-
39
-
40
-
41
-
42
-
43
-
44
-
45
-
46
-
47
-
48
-
49
-
50
-
51
-
52
-
53
-
54
-
55
-
56
-
57
-
58
-
59
-
60
-
61
-
62
-
63
-
64
-
65
-
66
-
67
-
68
-
69
-
70
-
71
-
72
-
73
-
74
-
75
-
76
-
77
-
78
-
79
-
 80
80 -
 81
81 -
 82
82 -
 83
83 -
 84
84 -
 85
85 -
 86
86 -
 87
87 -
 88
88 -
 89
89 -
 90
90 -
 91
91 -
 92
92 -
 93
93 -
 94
94 -
 95
95 -
 96
96 -
 97
97 -
 98
98 -
 99
99 -
 100
100 -
101
-
102
-
103
-
104
-
105
-
106
-
107
-
108
-
109
-
110
-
111
-
112
-
113
-
114
-
115
-
116
-
117
-
118
-
119
-
120
-
121
-
122
-
123
-
124
-
125
-
126
-
127
-
128
-
129
-
130
-
131
-
132
-
133
-
134
-
135
-
136
-
137
-
138
-
139
-
140
-
141
-
142
-
143
-
144
-
145
-
146
 |
 |

ABERCROMBIE & FITCH CO.
NOTES TO CONSOLIDATED FINANCIAL STATEMENTS — (Continued)
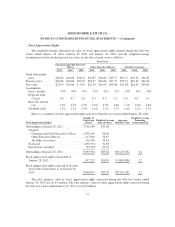
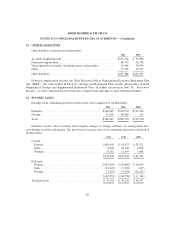
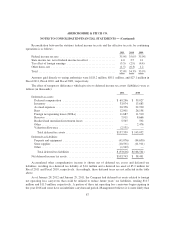
Reconciliation between the statutory federal income tax rate and the effective tax rate for continuing
operations is as follows:
2011 2010 2009
Federal income tax rate ....................................... 35.0% 35.0% 35.0%
State income tax, net of federal income tax effect ................... 4.0 2.5 2.1
Tax effect of foreign earnings .................................. (5.5) (2.9) (4.4)
Other items, net ............................................. (1.5) (0.3) 1.2
Total ...................................................... 32.0% 34.3% 33.9%
Amounts paid directly to taxing authorities were $118.2 million, $85.1 million, and $27.1 million in
Fiscal 2011, Fiscal 2010, and Fiscal 2009, respectively.
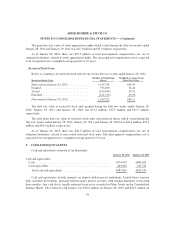
The effect of temporary differences which give rise to deferred income tax assets (liabilities) were as
follows (in thousands):
2011 2010
Deferred tax assets:
Deferred compensation ................................... $ 69,296 $ 59,027
Inventory .............................................. 33,074 13,683
Accrued expenses ........................................ 20,356 22,920
Rent .................................................. 12,001 26,158
Foreign net operating losses (NOLs) ......................... 11,687 11,510
Reserves ............................................... 7,911 8,666
Realized and unrealized investment losses .................... 5,565 592
Other .................................................. — 2,476
Valuation allowance ...................................... (2,531) —
Total deferred tax assets ................................. $157,359 $ 145,032
Deferred tax liabilities:
Property and equipment ................................... (41,076) (94,630)
Store supplies ........................................... (10,591) (11,911)
Other .................................................. (1,949) —
Total deferred tax liabilities .............................. $(53,616) $(106,541)
Net deferred income tax assets ................................ $103,743 $ 38,491
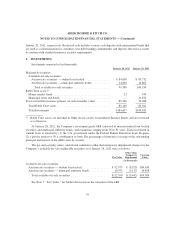
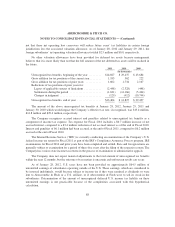
Accumulated other comprehensive income is shown net of deferred tax assets and deferred tax
liabilities, resulting in a deferred tax liability of $1.6 million and a deferred tax asset of $5.2 million for
Fiscal 2011 and Fiscal 2010, respectively. Accordingly, these deferred taxes are not reflected in the table
above.
As of January 28, 2012 and January 29, 2011, the Company had deferred tax assets related to foreign
net operating loss carryovers that could be utilized to reduce future years’ tax liabilities, totaling $11.7
million and $11.5 million, respectively. A portion of these net operating loss carryovers begin expiring in
the year 2016 and some have an indefinite carryforward period. Management believes it is more likely than
87