Abercrombie & Fitch 2011 Annual Report Download - page 37
Download and view the complete annual report
Please find page 37 of the 2011 Abercrombie & Fitch annual report below. You can navigate through the pages in the report by either clicking on the pages listed below, or by using the keyword search tool below to find specific information within the annual report.
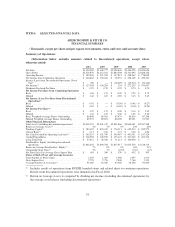
ITEM 6. SELECTED FINANCIAL DATA.
ABERCROMBIE & FITCH CO.
FINANCIAL SUMMARY
(Thousands, except per share and per square foot amounts, ratios and store and associate data)
Summary of Operations
(Information below excludes amounts related to discontinued operations, except where
otherwise noted)
2011 2010 2009 2008 2007
Net Sales .................................... $4,158,058 $3,468,777 $2,928,626 $3,484,058 $3,699,656
Gross Profit .................................. $2,518,870 $2,212,181 $1,883,598 $2,331,095 $2,488,166
Operating Income ............................. $ 190,030 $ 231,932 $ 117,912 $ 498,262 $ 778,909
Net Income from Continuing Operations ........... $ 126,862 $ 150,283 $ 78,953 $ 308,169 $ 499,127
Income (Loss) from Discontinued Operations, Net of
Tax(1) ..................................... $ 796 $ — $ (78,699) $ (35,914) $ (23,430)
Net Income(1) ................................. $ 127,658 $ 150,283 $ 254 $ 272,255 $ 475,697
Dividends Declared Per Share ................... $ 0.70 $ 0.70 $ 0.70 $ 0.70 $ 0.70
Net Income Per Share from Continuing Operations
Basic ....................................... $ 1.46 $ 1.71 $ 0.90 $ 3.55 $ 5.72
Diluted ..................................... $ 1.42 $ 1.67 $ 0.89 $ 3.45 $ 5.45
Net Income (Loss) Per Share from Discontinued
Operations(1)
Basic ....................................... $ 0.01 $ — $ (0.90) $ (0.41) $ (0.27)
Diluted ..................................... $ 0.01 $ — $ (0.89) $ (0.40) $ (0.26)
Net Income Per Share(1)
Basic ....................................... $ 1.47 $ 1.71 $ 0.00 $ 3.14 $ 5.45
Diluted ..................................... $ 1.43 $ 1.67 $ 0.00 $ 3.05 $ 5.20
Basic Weighted-Average Shares Outstanding ....... 86,848 88,061 87,874 86,816 87,248
Diluted Weighted-Average Shares Outstanding ...... 89,537 89,851 88,609 89,291 91,523
Other Financial Information
Total Assets (including discontinued operations) ..... $3,048,153 $2,941,415 $2,821,866 $2,848,181 $2,567,598
Return on Average Assets(2) ..................... 4% 5% 0% 10% 20%
Working Capital(3) ............................. $ 783,422 $ 874,417 $ 776,311 $ 622,213 $ 585,575
Current Ratio(4) ............................... $ 2.11 $ 2.56 $ 2.73 $ 2.38 $ 2.08
Net Cash Provided by Operating Activities(1) ........ $ 365,219 $ 391,789 $ 395,487 $ 491,031 $ 817,524
Capital Expenditures ........................... $ 318,598 $ 160,935 $ 175,472 $ 367,602 $ 403,345
Long-Term Debt .............................. $ 57,851 $ 68,566 $ 71,213 $ 100,000 $ —
Stockholders’ Equity (including discontinued
operations) ................................ $1,862,456 $1,890,784 $1,827,917 $1,845,578 $1,618,313
Return on Average Stockholders’ Equity(5) .......... 7% 8% 0% 16% 31%
Comparable Store Sales(6) ....................... 5% 7% (23)% (13)% (1)%
Net Store Sales Per Average Gross Square Foot ..... $ 463 $ 390 $ 339 $ 432 $ 503
Stores at End of Year and Average Associates
Total Number of Stores Open .................... 1,045 1,069 1,096 1,097 1,013
Gross Square Feet ............................. 7,778 7,756 7,848 7,760 7,133
Average Number of Associates(7) ................. 91,000 83,000 83,000 96,200 94,600
(1) Includes results of operations from RUEHL branded stores and related direct-to-consumer operations.
Results from discontinued operations were immaterial in Fiscal 2010.
(2) Return on Average Assets is computed by dividing net income (including discontinued operations) by
the average asset balance (including discontinued operations).
34


