Abercrombie & Fitch 2011 Annual Report Download - page 76
Download and view the complete annual report
Please find page 76 of the 2011 Abercrombie & Fitch annual report below. You can navigate through the pages in the report by either clicking on the pages listed below, or by using the keyword search tool below to find specific information within the annual report.-
 1
1 -
2
-
3
-
4
-
5
-
6
-
7
-
8
-
9
-
10
-
11
-
12
-
13
-
14
-
15
-
16
-
17
-
18
-
19
-
20
-
21
-
22
-
23
-
24
-
25
-
26
-
27
-
28
-
29
-
30
-
31
-
32
-
33
-
34
-
35
-
36
-
37
-
38
-
39
-
40
-
41
-
42
-
43
-
44
-
45
-
46
-
47
-
48
-
49
-
50
-
51
-
52
-
53
-
54
-
55
-
56
-
57
-
58
-
59
-
60
-
61
-
62
-
63
-
64
-
65
-
 66
66 -
 67
67 -
 68
68 -
 69
69 -
 70
70 -
 71
71 -
 72
72 -
 73
73 -
 74
74 -
 75
75 -
 76
76 -
 77
77 -
 78
78 -
 79
79 -
 80
80 -
 81
81 -
 82
82 -
 83
83 -
 84
84 -
 85
85 -
 86
86 -
87
-
88
-
89
-
90
-
91
-
92
-
93
-
94
-
95
-
96
-
97
-
98
-
99
-
100
-
101
-
102
-
103
-
104
-
105
-
106
-
107
-
108
-
109
-
110
-
111
-
112
-
113
-
114
-
115
-
116
-
117
-
118
-
119
-
120
-
121
-
122
-
123
-
124
-
125
-
126
-
127
-
128
-
129
-
130
-
131
-
132
-
133
-
134
-
135
-
136
-
137
-
138
-
139
-
140
-
141
-
142
-
143
-
144
-
145
-
146
 |
 |

ABERCROMBIE & FITCH CO.
NOTES TO CONSOLIDATED FINANCIAL STATEMENTS — (Continued)
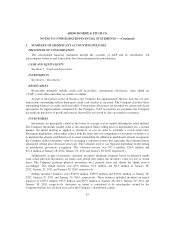
DESIGN AND DEVELOPMENT COSTS
Costs to design and develop the Company’s merchandise are expensed as incurred and are reflected as
a component of “Marketing, General and Administrative Expense.”
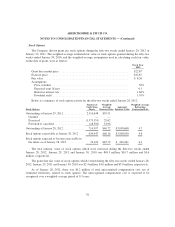
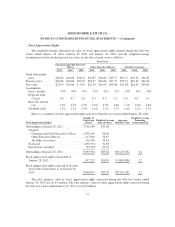
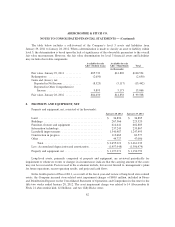
NET INCOME PER SHARE
Net income per basic share is computed based on the weighted-average number of outstanding shares
of Class A Common Stock (“Common Stock”). Net income per diluted share includes the weighted-
average effect of dilutive stock options, stock appreciation rights and restricted stock units.
Weighted-Average Shares Outstanding and Anti-Dilutive Shares (in thousands):
2011 2010 2009
Shares of Common Stock issued ....................... 103,300 103,300 103,300
Treasury shares ..................................... (16,452) (15,239) (15,426)
Weighted-Average — basic shares ...................... 86,848 88,061 87,874
Dilutive effect of stock options, stock appreciation rights and
restricted stock units ............................... 2,689 1,790 735
Weighted-Average — diluted shares .................... 89,537 89,851 88,609
Anti-Dilutive shares ................................. 2,452(1) 6,019(1) 6,698(1)
(1) Reflects the number of stock options, stock appreciation rights and restricted stock units outstanding,
but excluded from the computation of net income per diluted share because the impact would be anti-
dilutive.
SHARE-BASED COMPENSATION
See Note 4, “Share-Based Compensation.”
USE OF ESTIMATES IN THE PREPARATION OF FINANCIAL STATEMENTS
The preparation of financial statements in accordance with GAAP requires management to make
estimates and assumptions that affect the reported amounts of assets and liabilities as of the date of the
financial statements and the reported amounts of revenues and expenses during the reporting periods. Since
actual results may differ from those estimates, the Company revises its estimates and assumptions as new
information becomes available.
4. SHARE-BASED COMPENSATION
Financial Statement Impact
The Company recognized share-based compensation expense of $51.1 million, $40.6 million and
$36.1 million for the fifty-two week periods ended January 28, 2012, January 29, 2011 and January 30,
73