Abercrombie & Fitch 2011 Annual Report Download - page 81
Download and view the complete annual report
Please find page 81 of the 2011 Abercrombie & Fitch annual report below. You can navigate through the pages in the report by either clicking on the pages listed below, or by using the keyword search tool below to find specific information within the annual report.-
 1
1 -
2
-
3
-
4
-
5
-
6
-
7
-
8
-
9
-
10
-
11
-
12
-
13
-
14
-
15
-
16
-
17
-
18
-
19
-
20
-
21
-
22
-
23
-
24
-
25
-
26
-
27
-
28
-
29
-
30
-
31
-
32
-
33
-
34
-
35
-
36
-
37
-
38
-
39
-
40
-
41
-
42
-
43
-
44
-
45
-
46
-
47
-
48
-
49
-
50
-
51
-
52
-
53
-
54
-
55
-
56
-
57
-
58
-
59
-
60
-
61
-
62
-
63
-
64
-
65
-
66
-
67
-
68
-
69
-
70
-
 71
71 -
 72
72 -
 73
73 -
 74
74 -
 75
75 -
 76
76 -
 77
77 -
 78
78 -
 79
79 -
 80
80 -
 81
81 -
 82
82 -
 83
83 -
 84
84 -
 85
85 -
 86
86 -
 87
87 -
 88
88 -
 89
89 -
 90
90 -
 91
91 -
92
-
93
-
94
-
95
-
96
-
97
-
98
-
99
-
100
-
101
-
102
-
103
-
104
-
105
-
106
-
107
-
108
-
109
-
110
-
111
-
112
-
113
-
114
-
115
-
116
-
117
-
118
-
119
-
120
-
121
-
122
-
123
-
124
-
125
-
126
-
127
-
128
-
129
-
130
-
131
-
132
-
133
-
134
-
135
-
136
-
137
-
138
-
139
-
140
-
141
-
142
-
143
-
144
-
145
-
146
 |
 |

ABERCROMBIE & FITCH CO.
NOTES TO CONSOLIDATED FINANCIAL STATEMENTS — (Continued)
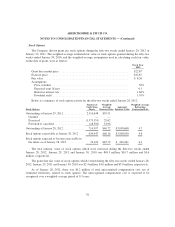
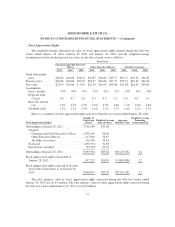
The grant date fair value of stock appreciation rights which vested during the fifty-two weeks ended
January 28, 2012 and January 29, 2011 was $11.3 million and $5.0 million, respectively.
As of January 28, 2012, there was $72.5 million of total unrecognized compensation cost, net of
estimated forfeitures, related to stock appreciation rights. The unrecognized compensation cost is expected
to be recognized over a weighted-average period of 1.0 years.
Restricted Stock Units
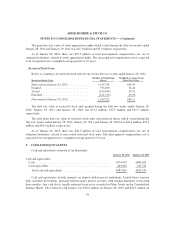
Below is a summary of restricted stock unit activity for the fifty-two weeks ended January 28, 2012:
Restricted Stock Units
Number of Underlying
Shares
Weighted-Average Grant
Date Fair Value
Non-vested at January 29, 2011 .............. 1,147,754 $49.59
Granted ................................. 573,450 54.44
Vested ................................. (410,540) 59.31
Forfeited ................................ (121,372) 43.90
Non-vested at January 28, 2012 .............. 1,189,292 $49.11
The total fair value of restricted stock units granted during the fifty-two weeks ended January 28,
2012, January 29, 2011 and January 30, 2010 was $31.2 million, $17.9 million and $11.5 million,
respectively.
The total grant date fair value of restricted stock units and restricted shares which vested during the
fifty-two weeks ended January 28, 2012, January 29, 2011 and January 30, 2010 was $24.3 million, $24.3
million and $26.4 million, respectively.
As of January 28, 2012, there was $34.5 million of total unrecognized compensation cost, net of
estimated forfeitures, related to non-vested restricted stock units. The unrecognized compensation cost is
expected to be recognized over a weighted-average period of 1.0 year.
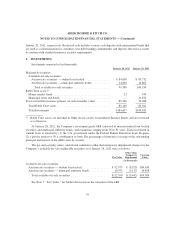
5. CASH AND EQUIVALENTS
Cash and equivalents consisted of (in thousands):
January 28, 2012 January 29, 2011
Cash and equivalents:
Cash ..................................................... $374,479 $300,624
Cash equivalents ........................................... 209,016 525,729
Total cash and equivalents ................................. $583,495 $826,353
Cash and equivalents include amounts on deposit with financial institutions, United States treasury
bills, and other investments, primarily held in money market accounts, with original maturities of less than
three months. Any cash that is legally restricted from use is recorded in Other Assets on the Consolidated
Balance Sheets. The restricted cash balance was $30.0 million on January 28, 2012 and $26.3 million on
78