Abercrombie & Fitch 2011 Annual Report Download - page 44
Download and view the complete annual report
Please find page 44 of the 2011 Abercrombie & Fitch annual report below. You can navigate through the pages in the report by either clicking on the pages listed below, or by using the keyword search tool below to find specific information within the annual report.-
 1
1 -
2
-
3
-
4
-
5
-
6
-
7
-
8
-
9
-
10
-
11
-
12
-
13
-
14
-
15
-
16
-
17
-
18
-
19
-
20
-
21
-
22
-
23
-
24
-
25
-
26
-
27
-
28
-
29
-
30
-
31
-
32
-
33
-
 34
34 -
 35
35 -
 36
36 -
 37
37 -
 38
38 -
 39
39 -
 40
40 -
 41
41 -
 42
42 -
 43
43 -
 44
44 -
 45
45 -
 46
46 -
 47
47 -
 48
48 -
 49
49 -
 50
50 -
 51
51 -
 52
52 -
 53
53 -
 54
54 -
55
-
56
-
57
-
58
-
59
-
60
-
61
-
62
-
63
-
64
-
65
-
66
-
67
-
68
-
69
-
70
-
71
-
72
-
73
-
74
-
75
-
76
-
77
-
78
-
79
-
80
-
81
-
82
-
83
-
84
-
85
-
86
-
87
-
88
-
89
-
90
-
91
-
92
-
93
-
94
-
95
-
96
-
97
-
98
-
99
-
100
-
101
-
102
-
103
-
104
-
105
-
106
-
107
-
108
-
109
-
110
-
111
-
112
-
113
-
114
-
115
-
116
-
117
-
118
-
119
-
120
-
121
-
122
-
123
-
124
-
125
-
126
-
127
-
128
-
129
-
130
-
131
-
132
-
133
-
134
-
135
-
136
-
137
-
138
-
139
-
140
-
141
-
142
-
143
-
144
-
145
-
146
 |
 |

• Operating income and operating income as a percentage of net sales;
• Net income;
• Inventory per gross square foot;
• Cash flow and liquidity determined by the Company’s current ratio and cash provided by
operations; and
• Store metrics such as sales per gross square foot, sales per selling square foot, average unit retail,
average number of transactions per store, average transaction values, store contribution (defined as
store sales less direct costs of running the store), and average units per transaction.
While not all of these metrics are disclosed publicly by the Company due to the proprietary nature of
the information, the Company publicly discloses and discusses many of these metrics as part of its
“Financial Summary” and in several sections within this Management’s Discussion and Analysis of
Financial Condition and Results of Operations.
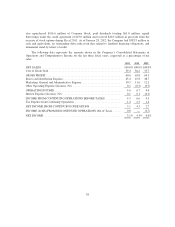
FISCAL 2011 COMPARED TO FISCAL 2010
Net Sales
Net sales for Fiscal 2011 were $4.158 billion, an increase of 20% from Fiscal 2010 net sales of $3.469
billion. The net sales increase was attributable to new stores, primarily international, a 5% increase in
comparable store sales, and a 36% increase in the direct-to-consumer business, including shipping and
handling revenue. The impact of foreign currency on sales (based on converting prior year sales at current
year exchange rates) for Fiscal 2011 and Fiscal 2010 was a benefit of $21.6 million and $4.9 million,
respectively.
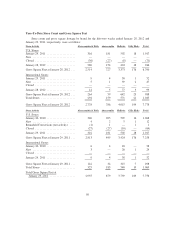
Total Company U.S. store sales for Fiscal 2011 were $2.711 billion, an increase of 6% from Fiscal
2010 sales of $2.547 billion. Total Company international store sales for Fiscal 2011 were $876.6 million,
an increase of 74% from Fiscal 2010 sales of $505.1 million.
Direct-to-consumer sales in Fiscal 2011, including shipping and handling revenue, were $552.6
million, an increase of 36% from Fiscal 2010 direct-to-consumer sales of $405.0 million. The
direct-to-consumer business, including shipping and handling revenue, accounted for 13.3% of total net
sales in Fiscal 2011 compared to 11.7% in Fiscal 2010.
Comparable store sales by brand for Fiscal 2011 were as follows: Abercrombie & Fitch increased 3%,
with men’s and women’s increasing by a low single digit percent. abercrombie kids increased 4%, with
guys increasing by a high single digit and girls increasing by a low single digit. Hollister increased 8%,
with dudes and bettys increasing by a high single digit.
On a comparable store sales basis, the Southern and the Western regions of the U.S. were the strongest
performing regions, while Canada and Japan were the weakest.
From a merchandise classification standpoint, fleece, active wear, and knit tops were stronger
performing categories for the male business while graphics and woven shirts were the weaker performing
categories. In the female business, woven shirts, sweaters, and knit tops were stronger performing
categories, while graphics and dresses were weaker performing categories.
41