Abercrombie & Fitch 2011 Annual Report Download - page 41
Download and view the complete annual report
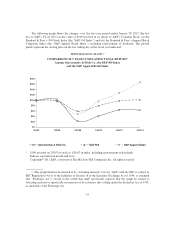
Please find page 41 of the 2011 Abercrombie & Fitch annual report below. You can navigate through the pages in the report by either clicking on the pages listed below, or by using the keyword search tool below to find specific information within the annual report.-
 1
1 -
2
-
3
-
4
-
5
-
6
-
7
-
8
-
9
-
10
-
11
-
12
-
13
-
14
-
15
-
16
-
17
-
18
-
19
-
20
-
21
-
22
-
23
-
24
-
25
-
26
-
27
-
28
-
29
-
30
-
 31
31 -
 32
32 -
 33
33 -
 34
34 -
 35
35 -
 36
36 -
 37
37 -
 38
38 -
 39
39 -
 40
40 -
 41
41 -
 42
42 -
 43
43 -
 44
44 -
 45
45 -
 46
46 -
 47
47 -
 48
48 -
 49
49 -
 50
50 -
 51
51 -
52
-
53
-
54
-
55
-
56
-
57
-
58
-
59
-
60
-
61
-
62
-
63
-
64
-
65
-
66
-
67
-
68
-
69
-
70
-
71
-
72
-
73
-
74
-
75
-
76
-
77
-
78
-
79
-
80
-
81
-
82
-
83
-
84
-
85
-
86
-
87
-
88
-
89
-
90
-
91
-
92
-
93
-
94
-
95
-
96
-
97
-
98
-
99
-
100
-
101
-
102
-
103
-
104
-
105
-
106
-
107
-
108
-
109
-
110
-
111
-
112
-
113
-
114
-
115
-
116
-
117
-
118
-
119
-
120
-
121
-
122
-
123
-
124
-
125
-
126
-
127
-
128
-
129
-
130
-
131
-
132
-
133
-
134
-
135
-
136
-
137
-
138
-
139
-
140
-
141
-
142
-
143
-
144
-
145
-
146
 |
 |

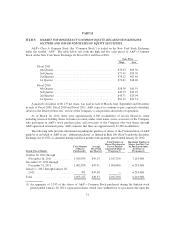
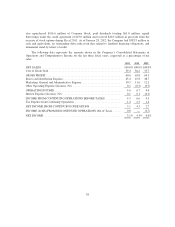
also repurchased $196.6 million of Common Stock, paid dividends totaling $61.0 million, repaid
borrowings under the credit agreement of $45.0 million and received $46.5 million in proceeds from the
exercise of stock options during Fiscal 2011. As of January 28, 2012, the Company had $583.5 million in
cash and equivalents, no outstanding debt aside from that related to landlord financing obligations, and
immaterial stand-by letters of credit.
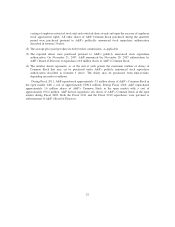
The following data represents the amounts shown in the Company’s Consolidated Statements of
Operations and Comprehensive Income for the last three fiscal years, expressed as a percentage of net
sales:
2011 2010 2009
NET SALES ........................................................ 100.0% 100.0% 100.0%
Cost of Goods Sold ................................................... 39.4 36.2 35.7
GROSS PROFIT ..................................................... 60.6 63.8 64.3
Stores and Distribution Expense ......................................... 45.4 45.8 48.7
Marketing, General and Administrative Expense ............................ 10.5 11.6 12.1
Other Operating Expense (Income), Net .................................. 0.1 (0.3) (0.5)
OPERATING INCOME ............................................... 4.6 6.7 4.0
Interest Expense (Income), Net ......................................... 0.1 0.1 (0.1)
INCOME FROM CONTINUING OPERATIONS BEFORE TAXES ........... 4.5 6.6 4.1
Tax Expense from Continuing Operations ................................. 1.4 2.3 1.4
NET INCOME FROM CONTINUING OPERATIONS ...................... 3.1 4.3 2.7
INCOME (LOSS) FROM DISCONTINUED OPERATIONS, Net of Taxes ...... 0.0 — (2.7)
NET INCOME ...................................................... 3.1% 4.3% 0.0%
38