Abercrombie & Fitch 2011 Annual Report Download - page 68
Download and view the complete annual report
Please find page 68 of the 2011 Abercrombie & Fitch annual report below. You can navigate through the pages in the report by either clicking on the pages listed below, or by using the keyword search tool below to find specific information within the annual report.-
 1
1 -
2
-
3
-
4
-
5
-
6
-
7
-
8
-
9
-
10
-
11
-
12
-
13
-
14
-
15
-
16
-
17
-
18
-
19
-
20
-
21
-
22
-
23
-
24
-
25
-
26
-
27
-
28
-
29
-
30
-
31
-
32
-
33
-
34
-
35
-
36
-
37
-
38
-
39
-
40
-
41
-
42
-
43
-
44
-
45
-
46
-
47
-
48
-
49
-
50
-
51
-
52
-
53
-
54
-
55
-
56
-
57
-
 58
58 -
 59
59 -
 60
60 -
 61
61 -
 62
62 -
 63
63 -
 64
64 -
 65
65 -
 66
66 -
 67
67 -
 68
68 -
 69
69 -
 70
70 -
 71
71 -
 72
72 -
 73
73 -
 74
74 -
 75
75 -
 76
76 -
 77
77 -
 78
78 -
79
-
80
-
81
-
82
-
83
-
84
-
85
-
86
-
87
-
88
-
89
-
90
-
91
-
92
-
93
-
94
-
95
-
96
-
97
-
98
-
99
-
100
-
101
-
102
-
103
-
104
-
105
-
106
-
107
-
108
-
109
-
110
-
111
-
112
-
113
-
114
-
115
-
116
-
117
-
118
-
119
-
120
-
121
-
122
-
123
-
124
-
125
-
126
-
127
-
128
-
129
-
130
-
131
-
132
-
133
-
134
-
135
-
136
-
137
-
138
-
139
-
140
-
141
-
142
-
143
-
144
-
145
-
146
 |
 |

ABERCROMBIE & FITCH CO.
NOTES TO CONSOLIDATED FINANCIAL STATEMENTS — (Continued)
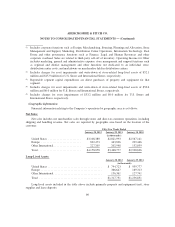
Operating income is the primary measure of profit the Company uses to make decisions on allocating
resources to its operating segments. For the U.S. Stores and International Stores reportable segments,
operating income is defined as aggregate income directly attributable to individual stores on a four-wall
basis. Four-wall costs include all costs contained “within the four walls of the stores”. These include
expenses such as cost of merchandise, selling payroll and related costs, rent, utilities, depreciation, other
variable expenses such as repairs and maintenance, supplies and packaging, as well as store sales related
expenses including credit card and bank fees and taxes. Four-wall costs also reflect pre-opening charges
related to stores not yet in operation. Four-wall costs exclude marketing, general and administrative
expense, store management, and support functions such as regional and district management and other
functions not dedicated to an individual store, distribution center costs, and markdowns on merchandise
held in distribution centers, all of which are included in Other.
Reportable segment assets include those used directly in or resulting from the operations of each
reportable segment. Total assets for the U.S. Stores and International Stores reportable segments primarily
consist of store cash, credit card receivables, prepaid rent, store supplies, lease deposits, merchandise
inventory and the net book value of store long-lived assets. International Stores also includes VAT
receivables. Total assets for the Direct-to-Consumer reportable segment primarily consist of credit card
receivables, merchandise inventory, and the net book value of information technology and distribution
center assets. Total assets for Other include cash and cash equivalents, investments, the net book value of
corporate property and equipment, the net book value of intangible assets, investments held in the Rabbi
Trust for deferred Compensation plans, foreign currency hedge assets and tax-related assets.
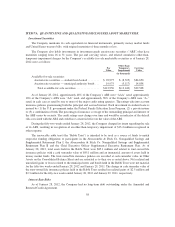
The following table provides the Company’s segment information as of, and for, the fiscal years
ended January 28, 2012, January 29, 2011 and January 30, 2010:
U.S. Stores
International
Stores
Direct-to-
Consumer
Operations
Segment
Total Other(1) Total
(In thousands):
January 28, 2012
Net Sales ............................$2,710,842 $876,613 $552,603 $4,140,058 $ 18,000 $4,158,058
Depreciation and Amortization ............ 125,827 35,844 2,876 164,547 68,409 232,956
Operating Income(2) ..................... 390,186 261,461 254,328 905,975 (715,945) 190,030
Total Assets .......................... 681,100 659,630 71,318 1,412,048 1,636,105 3,048,153
Capital Expenditures(3) ................... 1,105 229,959 8,367 239,431 79,167 318,598
January 29, 2011
Net Sales ............................ 2,546,798 505,136 404,974 3,456,908 11,869 3,468,777
Depreciation and Amortization ........... 149,533 17,680 3,154 170,367 58,786 229,153
Operating Income(4) ..................... 460,233 173,391 214,909 848,533 (616,601) 231,932
Total Assets .......................... 835,597 368,299 41,160 1,245,056 1,696,359 2,941,415
Capital Expenditures(3) ................... 24,706 85,435 816 110,957 49,978 160,935
January 30, 2010
Net Sales ............................ 2,377,771 256,216 290,102 2,924,089 4,537 2,928,626
Depreciation and Amortization ........... 175,286 8,388 3,750 187,424 51,328 238,752
Operating Income(5) ..................... 433,050 73,813 165,071 671,934 (554,022) 117,912
Total Assets .......................... 948,376 231,964 30,574 1,210,914 1,610,952 2,821,866
Capital Expenditures(3) ................... 52,964 77,420 428 130,812 44,660 175,472
65