Abercrombie & Fitch 2011 Annual Report Download - page 65
Download and view the complete annual report
Please find page 65 of the 2011 Abercrombie & Fitch annual report below. You can navigate through the pages in the report by either clicking on the pages listed below, or by using the keyword search tool below to find specific information within the annual report.-
 1
1 -
2
-
3
-
4
-
5
-
6
-
7
-
8
-
9
-
10
-
11
-
12
-
13
-
14
-
15
-
16
-
17
-
18
-
19
-
20
-
21
-
22
-
23
-
24
-
25
-
26
-
27
-
28
-
29
-
30
-
31
-
32
-
33
-
34
-
35
-
36
-
37
-
38
-
39
-
40
-
41
-
42
-
43
-
44
-
45
-
46
-
47
-
48
-
49
-
50
-
51
-
52
-
53
-
54
-
 55
55 -
 56
56 -
 57
57 -
 58
58 -
 59
59 -
 60
60 -
 61
61 -
 62
62 -
 63
63 -
 64
64 -
 65
65 -
 66
66 -
 67
67 -
 68
68 -
 69
69 -
 70
70 -
 71
71 -
 72
72 -
 73
73 -
 74
74 -
 75
75 -
76
-
77
-
78
-
79
-
80
-
81
-
82
-
83
-
84
-
85
-
86
-
87
-
88
-
89
-
90
-
91
-
92
-
93
-
94
-
95
-
96
-
97
-
98
-
99
-
100
-
101
-
102
-
103
-
104
-
105
-
106
-
107
-
108
-
109
-
110
-
111
-
112
-
113
-
114
-
115
-
116
-
117
-
118
-
119
-
120
-
121
-
122
-
123
-
124
-
125
-
126
-
127
-
128
-
129
-
130
-
131
-
132
-
133
-
134
-
135
-
136
-
137
-
138
-
139
-
140
-
141
-
142
-
143
-
144
-
145
-
146
 |
 |

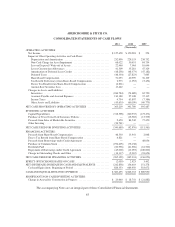
ABERCROMBIE & FITCH CO.
CONSOLIDATED STATEMENTS OF STOCKHOLDERS’ EQUITY
(Thousands, except per share amounts)
Common Stock
Paid-In
Capital
Retained
Earnings
Other
Comprehensive
(Loss) Income
Treasury Stock Total
Stockholders’
Equity
Shares
Outstanding
Par
Value Shares
At Average
Cost
Balance, January 31, 2009 ................. 87,636 $1,033 $328,488 $2,244,936 $(22,681) 15,664 $(706,198)$1,845,578
Net Income ............................... — — — 254 — — — 254
Dividends ($0.70 per share) ................... — — — (61,500) — — — (61,500)
Share-based Compensation Issuances and
Exercises ............................... 350 — (19,690) — — (350) 18,912 (778)
Tax Deficiency from Share-based Compensation
Issuances and Exercises .................... — — (5,454) — — — — (5,454)
Share-based Compensation Expense ............ — — 36,109 — — — — 36,109
Unrealized Gains on Marketable Securities ....... — — — — 8,217 — 8,217
Net Change in Unrealized Gains or Losses on
Derivative Financial Instruments ............. — — — — (451) — (451)
Foreign Currency Translation Adjustments ....... — — — — 5,942 — 5,942
Balance, January 30, 2010 .................... 87,986 $ 1,033 $ 339,453 $ 2,183,690 $ (8,973) 15,314 $ (687,286)$ 1,827,917
Net Income ............................... — — — 150,283 — — — 150,283
Purchase of Common Stock ................... (1,582) — — — — 1,582 (76,158) (76,158)
Dividends ($0.70 per share) ................... — — — (61,656) — — — (61,656)
Share-based Compensation Issuances and
Exercises ............................... 842 — (29,741) — — (842) 38,136 8,395
Tax Deficiency from Share-based Compensation
Issuances and Exercises .................... — — (1,053) — — — — (1,053)
Share-based Compensation Expense ............ — — 40,599 — — — — 40,599
Unrealized Losses on Marketable Securities ...... — — — — (622) — (622)
Net Change in Unrealized Gains or Losses on
Derivative Financial Instruments ............. — — — — (320) — (320)
Foreign Currency Translation Adjustments ....... — — — — 3,399 — 3,399
Balance, January 29, 2011 .................... 87,246 $ 1,033 $ 349,258 $ 2,272,317 $ (6,516) 16,054 $ (725,308)$ 1,890,784
Net Income ............................... — — — 127,658 — — — 127,658
Purchase of Common Stock ................... (3,546) — — — — 3,546 (196,605) (196,605)
Dividends ($0.70 per share) ................... — — — (60,956) — — — (60,956)
Share-based Compensation Issuances and
Exercises ............................... 1,938 — (34,153) (18,448) — (1,938) 87,139 34,538
Tax Benefit from Share-based Compensation
Issuances and Exercises .................... — — 2,973 — — — — 2,973
Share-based Compensation Expense ............ — — 51,093 — — — — 51,093
Losses on Marketable Securities reclassed to the
Income Statement ........................ — — — — 9,409 — 9,409
Net Change in Unrealized Gains or Losses on
Derivative Financial Instruments ............. — — — — 12,217 — 12,217
Foreign Currency Translation Adjustments ....... — — — — (8,655) — (8,655)
Balance, January 28, 2012 .................... 85,638 $ 1,033 $ 369,171 $ 2,320,571 $ 6,455 17,662 $ (834,774)$ 1,862,456
The accompanying Notes are an integral part of these Consolidated Financial Statements.
62