Abercrombie & Fitch 2011 Annual Report Download - page 39
Download and view the complete annual report
Please find page 39 of the 2011 Abercrombie & Fitch annual report below. You can navigate through the pages in the report by either clicking on the pages listed below, or by using the keyword search tool below to find specific information within the annual report.-
 1
1 -
2
-
3
-
4
-
5
-
6
-
7
-
8
-
9
-
10
-
11
-
12
-
13
-
14
-
15
-
16
-
17
-
18
-
19
-
20
-
21
-
22
-
23
-
24
-
25
-
26
-
27
-
28
-
 29
29 -
 30
30 -
 31
31 -
 32
32 -
 33
33 -
 34
34 -
 35
35 -
 36
36 -
 37
37 -
 38
38 -
 39
39 -
 40
40 -
 41
41 -
 42
42 -
 43
43 -
 44
44 -
 45
45 -
 46
46 -
 47
47 -
 48
48 -
 49
49 -
50
-
51
-
52
-
53
-
54
-
55
-
56
-
57
-
58
-
59
-
60
-
61
-
62
-
63
-
64
-
65
-
66
-
67
-
68
-
69
-
70
-
71
-
72
-
73
-
74
-
75
-
76
-
77
-
78
-
79
-
80
-
81
-
82
-
83
-
84
-
85
-
86
-
87
-
88
-
89
-
90
-
91
-
92
-
93
-
94
-
95
-
96
-
97
-
98
-
99
-
100
-
101
-
102
-
103
-
104
-
105
-
106
-
107
-
108
-
109
-
110
-
111
-
112
-
113
-
114
-
115
-
116
-
117
-
118
-
119
-
120
-
121
-
122
-
123
-
124
-
125
-
126
-
127
-
128
-
129
-
130
-
131
-
132
-
133
-
134
-
135
-
136
-
137
-
138
-
139
-
140
-
141
-
142
-
143
-
144
-
145
-
146
 |
 |
ITEM 7. MANAGEMENT’S DISCUSSION AND ANALYSIS OF FINANCIAL CONDITION AND
RESULTS OF OPERATIONS.
OVERVIEW
The Company’s fiscal year ends on the Saturday closest to January 31, typically resulting in a
fifty-two week year, but occasionally giving rise to an additional week, resulting in a fifty-three week year.
A store is included in comparable store sales when it has been open as the same brand at least one year and
its square footage has not been expanded or reduced by more than 20% within the past year.
For purposes of this “ITEM 7. MANAGEMENT’S DISCUSSION AND ANALYSIS OF
FINANCIAL CONDITION AND RESULTS OF OPERATIONS,” the fifty-two week period ended
January 28, 2012 is compared to the fifty-two week period ended January 29, 2011 and the fifty-two week
period ended January 29, 2011 is compared to the fifty-two week period ended January 30, 2010.
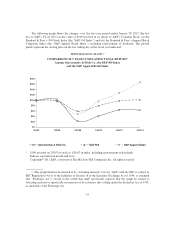
The Company had net sales of $4.158 billion for the fifty-two weeks ended January 28, 2012, an
increase of 20% from $3.469 billion for the fifty-two weeks ended January 29, 2011. Operating income for
Fiscal 2011 was $190.0 million, which was down from $231.9 million in Fiscal 2010.
Net income from continuing operations was $126.9 million and net income from continuing
operations per diluted share was $1.42 in Fiscal 2011, compared to net income from continuing operations
of $150.3 million and net income from continuing operations per diluted share of $1.67 in Fiscal 2010.
Excluding charges for impairments and write-downs of store-related long-lived assets, charges related
to store closures and lease exits, and other charges associated with legal settlements and a change in intent
regarding the Company’s auction rate securities (ARS), the Company reported adjusted, non-GAAP net
income per diluted share from continuing operations of $2.30 for the fifty-two weeks ended January 28,
2012. Excluding store-related asset impairment charges and exit charges associated with domestic store
closures, the Company reported non-GAAP net income per diluted share from continuing operations of
$2.05 for the fifty-two weeks ended January 29, 2011.
36