Abercrombie & Fitch 2011 Annual Report Download - page 69
Download and view the complete annual report
Please find page 69 of the 2011 Abercrombie & Fitch annual report below. You can navigate through the pages in the report by either clicking on the pages listed below, or by using the keyword search tool below to find specific information within the annual report.-
 1
1 -
2
-
3
-
4
-
5
-
6
-
7
-
8
-
9
-
10
-
11
-
12
-
13
-
14
-
15
-
16
-
17
-
18
-
19
-
20
-
21
-
22
-
23
-
24
-
25
-
26
-
27
-
28
-
29
-
30
-
31
-
32
-
33
-
34
-
35
-
36
-
37
-
38
-
39
-
40
-
41
-
42
-
43
-
44
-
45
-
46
-
47
-
48
-
49
-
50
-
51
-
52
-
53
-
54
-
55
-
56
-
57
-
58
-
 59
59 -
 60
60 -
 61
61 -
 62
62 -
 63
63 -
 64
64 -
 65
65 -
 66
66 -
 67
67 -
 68
68 -
 69
69 -
 70
70 -
 71
71 -
 72
72 -
 73
73 -
 74
74 -
 75
75 -
 76
76 -
 77
77 -
 78
78 -
 79
79 -
80
-
81
-
82
-
83
-
84
-
85
-
86
-
87
-
88
-
89
-
90
-
91
-
92
-
93
-
94
-
95
-
96
-
97
-
98
-
99
-
100
-
101
-
102
-
103
-
104
-
105
-
106
-
107
-
108
-
109
-
110
-
111
-
112
-
113
-
114
-
115
-
116
-
117
-
118
-
119
-
120
-
121
-
122
-
123
-
124
-
125
-
126
-
127
-
128
-
129
-
130
-
131
-
132
-
133
-
134
-
135
-
136
-
137
-
138
-
139
-
140
-
141
-
142
-
143
-
144
-
145
-
146
 |
 |

ABERCROMBIE & FITCH CO.
NOTES TO CONSOLIDATED FINANCIAL STATEMENTS — (Continued)
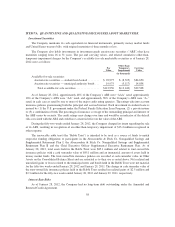
(1) Includes corporate functions such as Design, Merchandising, Sourcing, Planning and Allocation, Store
Management and Support, Marketing, Distribution Center Operations, Information Technology, Real
Estate and other governance functions such as Finance, Legal and Human Resources and other
corporate overhead. Sales are related to third-party sell-off of inventory. Operating Income for Other
includes marketing, general and administrative expense; store management and support functions such
as regional and district management and other functions not dedicated to an individual store;
distribution center costs; and markdowns on merchandise held in distribution centers.
(2) Includes charges for asset impairments and write-down of store-related long-lived assets of $52.1
million and $15.9 million for U.S. Stores and International Stores, respectively.
(3) Reportable segment capital expenditures are direct purchases of property and equipment for that
segment.
(4) Includes charges for asset impairments and write-down of store-related long-lived assets of $50.6
million and $0.0 million for U.S. Stores and International Stores, respectively.
(5) Includes charges for asset impairments of $33.2 million and $0.0 million for U.S. Stores and
International Stores, respectively.
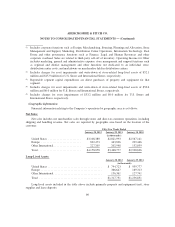
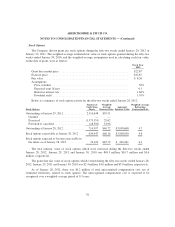
Geographic Information
Financial information relating to the Company’s operations by geographic area is as follows:
Net Sales:
Net sales includes net merchandise sales through stores and direct-to-consumer operations, including
shipping and handling revenue. Net sales are reported by geographic area based on the location of the
customer.
Fifty-Two Weeks Ended
January 28, 2012 January 29, 2011 January 30, 2010
(in thousands):
United States ....................... $3,108,380 $2,821,993 $2,567,141
Europe ............................ 822,473 443,836 229,446
Other International ................... 227,205 202,948 132,039
Total .............................. $4,158,058 $3,468,777 $2,928,626
Long-Lived Assets:
January 28, 2012 January 29, 2011
(in thousands):
United States ...................................... $ 794,723 $ 959,777
Europe ........................................... 366,647 169,313
Other International ................................. 156,361 127,741
Total ............................................ $1,317,731 $1,256,831
Long-lived assets included in the table above include primarily property and equipment (net), store
supplies and lease deposits.
66