Abercrombie & Fitch 2011 Annual Report Download - page 63
Download and view the complete annual report
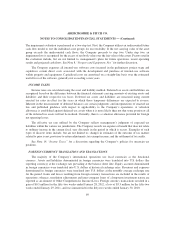
Please find page 63 of the 2011 Abercrombie & Fitch annual report below. You can navigate through the pages in the report by either clicking on the pages listed below, or by using the keyword search tool below to find specific information within the annual report.-
 1
1 -
2
-
3
-
4
-
5
-
6
-
7
-
8
-
9
-
10
-
11
-
12
-
13
-
14
-
15
-
16
-
17
-
18
-
19
-
20
-
21
-
22
-
23
-
24
-
25
-
26
-
27
-
28
-
29
-
30
-
31
-
32
-
33
-
34
-
35
-
36
-
37
-
38
-
39
-
40
-
41
-
42
-
43
-
44
-
45
-
46
-
47
-
48
-
49
-
50
-
51
-
52
-
 53
53 -
 54
54 -
 55
55 -
 56
56 -
 57
57 -
 58
58 -
 59
59 -
 60
60 -
 61
61 -
 62
62 -
 63
63 -
 64
64 -
 65
65 -
 66
66 -
 67
67 -
 68
68 -
 69
69 -
 70
70 -
 71
71 -
 72
72 -
 73
73 -
74
-
75
-
76
-
77
-
78
-
79
-
80
-
81
-
82
-
83
-
84
-
85
-
86
-
87
-
88
-
89
-
90
-
91
-
92
-
93
-
94
-
95
-
96
-
97
-
98
-
99
-
100
-
101
-
102
-
103
-
104
-
105
-
106
-
107
-
108
-
109
-
110
-
111
-
112
-
113
-
114
-
115
-
116
-
117
-
118
-
119
-
120
-
121
-
122
-
123
-
124
-
125
-
126
-
127
-
128
-
129
-
130
-
131
-
132
-
133
-
134
-
135
-
136
-
137
-
138
-
139
-
140
-
141
-
142
-
143
-
144
-
145
-
146
 |
 |

ITEM 8. FINANCIAL STATEMENTS AND SUPPLEMENTARY DATA
ABERCROMBIE & FITCH CO.
CONSOLIDATED STATEMENTS OF OPERATIONS AND COMPREHENSIVE INCOME
(Thousands, except share and per share amounts)
2011 2010 2009
NET SALES ................................................... $4,158,058 $3,468,777 $2,928,626
Cost of Goods Sold .............................................. 1,639,188 1,256,596 1,045,028
GROSS PROFIT ................................................ 2,518,870 2,212,181 1,883,598
Stores and Distribution Expense .................................... 1,888,248 1,589,501 1,425,950
Marketing, General and Administrative Expense ....................... 437,120 400,804 353,269
Other Operating Expense (Income), Net .............................. 3,472 (10,056) (13,533)
OPERATING INCOME .......................................... 190,030 231,932 117,912
Interest Expense (Income), Net ..................................... 3,577 3,362 (1,598)
INCOME FROM CONTINUING OPERATIONS BEFORE TAXES ....... 186,453 228,570 119,510
Tax Expense from Continuing Operations ............................ 59,591 78,287 40,557
NET INCOME FROM CONTINUING OPERATIONS ................. $ 126,862 $ 150,283 $ 78,953
INCOME (LOSS) FROM DISCONTINUED OPERATIONS, Net of Tax . . . $ 796 $ — $ (78,699)
NET INCOME .................................................. $ 127,658 $ 150,283 $ 254
NET INCOME PER SHARE FROM CONTINUING OPERATIONS:
BASIC ...................................................... $ 1.46 $ 1.71 $ 0.90
DILUTED ................................................... $ 1.42 $ 1.67 $ 0.89
NET INCOME (LOSS) PER SHARE FROM DISCONTINUED
OPERATIONS:
BASIC ...................................................... $ 0.01 $ — $ (0.90)
DILUTED ................................................... $ 0.01 $ — $ (0.89)
NET INCOME PER SHARE:
BASIC ...................................................... $ 1.47 $ 1.71 $ 0.00
DILUTED ................................................... $ 1.43 $ 1.67 $ 0.00
WEIGHTED-AVERAGE SHARES OUTSTANDING:
BASIC ...................................................... 86,848 88,061 87,874
DILUTED ................................................... 89,537 89,851 88,609
DIVIDENDS DECLARED PER SHARE ............................. $ 0.70 $ 0.70 $ 0.70
OTHER COMPREHENSIVE INCOME (LOSS)
Foreign Currency Translation Adjustments ......................... $ (8,655) $ 3,399 $ 5,942
Gains (Losses) on Marketable Securities, net of taxes of $(5,526), $366
and $(4,826) for Fiscal 2011, Fiscal 2010 and Fiscal 2009,
respectively. ................................................ 9,409 (622) 8,217
Unrealized Gain (Loss) on Derivative Financial Instruments, net of taxes
of $(1,216), $188 and $265 for Fiscal 2011, Fiscal 2010 and Fiscal
2009, respectively. ........................................... 12,217 (320) (451)
Other Comprehensive Income .................................... $ 12,971 $ 2,457 $ 13,708
COMPREHENSIVE INCOME ..................................... $ 140,629 $ 152,740 $ 13,962
The accompanying Notes are an integral part of these Consolidated Financial Statements.
60