Abercrombie & Fitch 2011 Annual Report Download - page 42
Download and view the complete annual report
Please find page 42 of the 2011 Abercrombie & Fitch annual report below. You can navigate through the pages in the report by either clicking on the pages listed below, or by using the keyword search tool below to find specific information within the annual report.-
 1
1 -
2
-
3
-
4
-
5
-
6
-
7
-
8
-
9
-
10
-
11
-
12
-
13
-
14
-
15
-
16
-
17
-
18
-
19
-
20
-
21
-
22
-
23
-
24
-
25
-
26
-
27
-
28
-
29
-
30
-
31
-
 32
32 -
 33
33 -
 34
34 -
 35
35 -
 36
36 -
 37
37 -
 38
38 -
 39
39 -
 40
40 -
 41
41 -
 42
42 -
 43
43 -
 44
44 -
 45
45 -
 46
46 -
 47
47 -
 48
48 -
 49
49 -
 50
50 -
 51
51 -
 52
52 -
53
-
54
-
55
-
56
-
57
-
58
-
59
-
60
-
61
-
62
-
63
-
64
-
65
-
66
-
67
-
68
-
69
-
70
-
71
-
72
-
73
-
74
-
75
-
76
-
77
-
78
-
79
-
80
-
81
-
82
-
83
-
84
-
85
-
86
-
87
-
88
-
89
-
90
-
91
-
92
-
93
-
94
-
95
-
96
-
97
-
98
-
99
-
100
-
101
-
102
-
103
-
104
-
105
-
106
-
107
-
108
-
109
-
110
-
111
-
112
-
113
-
114
-
115
-
116
-
117
-
118
-
119
-
120
-
121
-
122
-
123
-
124
-
125
-
126
-
127
-
128
-
129
-
130
-
131
-
132
-
133
-
134
-
135
-
136
-
137
-
138
-
139
-
140
-
141
-
142
-
143
-
144
-
145
-
146
 |
 |

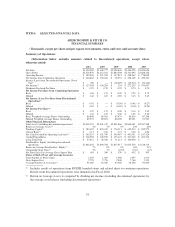
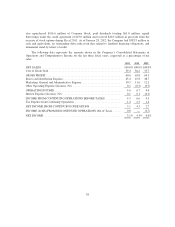
FINANCIAL SUMMARY
The following summarized financial and statistical data compares Fiscal 2011 to Fiscal 2010, Fiscal
2010 to Fiscal 2009, and Fiscal 2009 to Fiscal 2008:
2011 2010 2009
Net sales by segment (in thousands) ....................... $4,158,058 $3,468,777 $2,928,626
U.S. Stores .......................................... $2,710,842 $2,546,798 $2,377,771
International Stores ................................... $ 876,613 $ 505,136 $ 256,216
Direct-to-consumer ................................... $ 552,603 $ 404,974 $ 290,102
Other .............................................. $ 18,000 $ 11,869 $ 4,537
Increase (decrease) in net sales from prior year ............. 20% 18% (16)%
U.S. Stores .......................................... 6% 7% (21)%
International Stores ................................... 74% 97% 70%
Direct-to-consumer ................................... 36% 40% (8)%
Other .............................................. 52% 162% 15%
Net sales by brand (in thousands) ........................ $4,158,058 $3,468,777 $2,928,626
Abercrombie & Fitch .................................. $1,665,135 $1,493,101 $1,272,287
abercrombie ......................................... $ 397,904 $ 382,579 $ 343,164
Hollister ............................................ $2,022,002 $1,552,814 $1,287,241
Gilly Hicks** ........................................ $ 73,017 $ 40,283 $ 25,934
Increase (decrease) in net sales from prior year ............. 20% 18% (16)%
Abercrombie & Fitch .................................. 12% 17% (17)%
abercrombie ......................................... 4% 11% (18)%
Hollister ............................................ 30% 21% (15)%
Gilly Hicks .......................................... 81% 55% 45%
Increase (decrease) in comparable store sales* ............. 5% 7% (23)%
Abercrombie & Fitch .................................. 3% 9% (19)%
abercrombie ......................................... 4% 5% (23)%
Hollister ............................................ 8% 6% (27)%
* A store is included in comparable store sales when it has been open as the same brand 12 months or
more and its square footage has not been expanded or reduced by more than 20% within the past year.
** Net sales for the fifty-two week periods ended January 28, 2012, January 29, 2011 and January 30,
2010 reflect the activity of 21, 19 and 16 stores, respectively.
CURRENT TRENDS AND OUTLOOK
Our results for Fiscal 2011 were below our expectations in a very challenging environment. During
Fiscal 2011, we saw all-time high cotton costs, resulting in higher average unit costs. In addition, we were
not able to offset the increases in the costs with increased average unit retail prices due to a highly
aggressive promotional environment in the U.S. We expect to see a significant reversal in the average unit
cost trend in Fiscal 2012, especially in the second half of the year; however, we remain cautious about our
ability to raise average unit retail prices in the U.S. We expect significant margin improvement in Fiscal
2012 due primarily to a combination of average unit cost reductions and the expected performance of our
39