Abercrombie & Fitch 2009 Annual Report Download - page 70
Download and view the complete annual report
Please find page 70 of the 2009 Abercrombie & Fitch annual report below. You can navigate through the pages in the report by either clicking on the pages listed below, or by using the keyword search tool below to find specific information within the annual report.-
 1
1 -
2
-
3
-
4
-
5
-
6
-
7
-
8
-
9
-
10
-
11
-
12
-
13
-
14
-
15
-
16
-
17
-
18
-
19
-
20
-
21
-
22
-
23
-
24
-
25
-
26
-
27
-
28
-
29
-
30
-
31
-
32
-
33
-
34
-
35
-
36
-
37
-
38
-
39
-
40
-
41
-
42
-
43
-
44
-
45
-
46
-
47
-
48
-
49
-
50
-
51
-
52
-
53
-
54
-
55
-
56
-
57
-
58
-
59
-
 60
60 -
 61
61 -
 62
62 -
 63
63 -
 64
64 -
 65
65 -
 66
66 -
 67
67 -
 68
68 -
 69
69 -
 70
70 -
 71
71 -
 72
72 -
 73
73 -
 74
74 -
 75
75 -
 76
76 -
 77
77 -
 78
78 -
 79
79 -
 80
80 -
81
-
82
-
83
-
84
-
85
-
86
-
87
-
88
-
89
-
90
-
91
-
92
-
93
-
94
-
95
-
96
-
97
-
98
-
99
-
100
-
101
-
102
-
103
-
104
-
105
 |
 |

As of January 30, 2010, approximately 70% of the Company’s ARS were “AAA” rated and approx-
imately 14% of the Company’s ARS were “AA” or “A” rated with the remaining ARS having an “A⫺”or
“BBB+” rating, in each case as rated by one or more of the major credit rating agencies.
In Fiscal 2008, the Company elected to apply fair value accounting for the Put Option related to the
Company’s UBS ARS. The fair value of the Put Option was determined by calculating the present value of the
difference between the par value and the fair value of the UBS ARS as of January 30, 2010, adjusted for
counterparty risk. The present value was calculated using a discount rate that incorporates an investment
grade corporate bond index rate and the credit default swap rate for UBS. The Put Option is recognized as an
asset within Other Current Assets on the accompanying Consolidated Balance Sheets and the corresponding
gains and losses within Other Operating Income, Net on the accompanying Consolidated Statements of
Operations and Comprehensive Income.
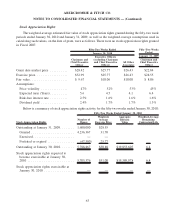
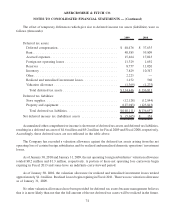
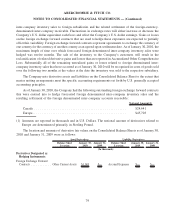
The table below includes a roll forward of the Company’s level 3 assets from January 31, 2009 to
January 30, 2010. When a determination is made to classify an asset or liability within level 3, the
determination is based upon the lack of significance of the observable parameters to the overall fair value
measurement. However, the fair value determination for level 3 financial assets and liabilities may include
observable components.
Trading ARS -
Student Loans
Trading ARS -
Muni Bonds
Available-for-sale
ARS - Student Loans
Available-for-sale
ARS - Muni Bonds
Put
Option Total
(In thousands)
Fair value, January 31, 2009. . $ 50,589 $11,959 $139,239 $27,294 $12,309 $241,390
Redemptions ............ (39,400) — (31,650) (6,400) — (77,450)
Transfers (out)/in ......... — — — — — —
Gains and (losses), net:
Reported in Net Income . . . 8,860 348 — — (7,669) 1,539
Reported in Other
Comprehensive Income
(Loss) ............. — — 10,801 2,510 — 13,311
Fair value, January 30, 2010. . $ 20,049 $12,307 $118,390 $23,404 $ 4,640 $178,790
69
ABERCROMBIE & FITCH CO.
NOTES TO CONSOLIDATED FINANCIAL STATEMENTS — (Continued)