Abercrombie & Fitch 2009 Annual Report Download - page 52
Download and view the complete annual report
Please find page 52 of the 2009 Abercrombie & Fitch annual report below. You can navigate through the pages in the report by either clicking on the pages listed below, or by using the keyword search tool below to find specific information within the annual report.-
 1
1 -
2
-
3
-
4
-
5
-
6
-
7
-
8
-
9
-
10
-
11
-
12
-
13
-
14
-
15
-
16
-
17
-
18
-
19
-
20
-
21
-
22
-
23
-
24
-
25
-
26
-
27
-
28
-
29
-
30
-
31
-
32
-
33
-
34
-
35
-
36
-
37
-
38
-
39
-
40
-
41
-
 42
42 -
 43
43 -
 44
44 -
 45
45 -
 46
46 -
 47
47 -
 48
48 -
 49
49 -
 50
50 -
 51
51 -
 52
52 -
 53
53 -
 54
54 -
 55
55 -
 56
56 -
 57
57 -
 58
58 -
 59
59 -
 60
60 -
 61
61 -
 62
62 -
63
-
64
-
65
-
66
-
67
-
68
-
69
-
70
-
71
-
72
-
73
-
74
-
75
-
76
-
77
-
78
-
79
-
80
-
81
-
82
-
83
-
84
-
85
-
86
-
87
-
88
-
89
-
90
-
91
-
92
-
93
-
94
-
95
-
96
-
97
-
98
-
99
-
100
-
101
-
102
-
103
-
104
-
105
 |
 |

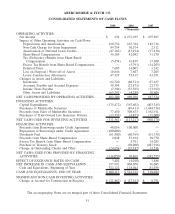
ABERCROMBIE & FITCH CO.
CONSOLIDATED STATEMENTS OF CASH FLOWS
2009 2008 2007
(Thousands)
OPERATING ACTIVITIES:
Net Income ..................................... $ 254 $272,255 $ 475,697
Impact of Other Operating Activities on Cash Flows:
Depreciation and Amortization ..................... 238,752 225,334 183,716
Non-Cash Charge for Asset Impairment .............. 84,754 30,574 2,312
Amortization of Deferred Lease Credits .............. (47,182) (43,194) (37,418)
Share-Based Compensation ........................ 36,109 42,042 31,170
Tax (Deficiency) Benefit from Share-Based
Compensation................................ (5,454) 16,839 17,600
Excess Tax Benefit from Share-Based Compensation ..... — (5,791) (14,205)
Deferred Taxes ................................. 7,605 14,005 1,342
Loss on Disposal / Write-off of Assets ............... 10,646 7,607 7,205
Lessor Construction Allowances .................... 47,329 55,415 43,391
Changes in Assets and Liabilities:
Inventories .................................... 62,720 (40,521) 87,657
Accounts Payable and Accrued Expenses ............. 39,394 (23,875) 22,375
Income Taxes Payable ........................... (7,386) (55,565) (13,922)
Other Assets and Liabilities ....................... (65,341) (4,289) 10,604
NET CASH PROVIDED BY OPERATING ACTIVITIES ..... 402,200 490,836 817,524
INVESTING ACTIVITIES:
Capital Expenditures .............................. (175,472) (367,602) (403,345)
Purchases of Marketable Securities .................... — (49,411) (1,444,736)
Proceeds from Sales of Marketable Securities ............ 77,450 308,673 1,362,911
Purchases of Trust-Owned Life Insurance Policies......... (13,539) (4,877) (15,000)
NET CASH USED FOR INVESTING ACTIVITIES ........ (111,561) (113,217) (500,170)
FINANCING ACTIVITIES:
Proceeds from Borrowings under Credit Agreement ....... 48,056 100,000 —
Repayment of Borrowings under Credit Agreement ........ (100,000) — —
Dividends Paid................................... (61,500) (60,769) (61,330)
Proceeds from Share-Based Compensation .............. 2,048 55,194 38,750
Excess Tax Benefit from Share-Based Compensation ...... — 5,791 14,205
Purchase of Treasury Stock ......................... — (50,000) (287,916)
Change in Outstanding Checks and Other ............... (24,654) (19,747) 13,536
NET CASH (USED FOR) PROVIDED BY FINANCING
ACTIVITIES .................................... (136,050) 30,469 (282,755)
EFFECT OF EXCHANGE RATES ON CASH ............. 3,402 (4,010) 1,486
NET INCREASE IN CASH AND EQUIVALENTS ......... 157,991 404,078 36,085
Cash and Equivalents, Beginning of Year ............... 522,122 118,044 81,959
CASH AND EQUIVALENTS, END OF YEAR ............ $680,113 $ 522,122 $ 118,044
SIGNIFICANT NON-CASH INVESTING ACTIVITIES:
Change in Accrual for Construction in Progress .......... $ (21,882) $ (27,913) $ 8,791
The accompanying Notes are an integral part of these Consolidated Financial Statements.
51