Abercrombie & Fitch 2009 Annual Report Download - page 26
Download and view the complete annual report
Please find page 26 of the 2009 Abercrombie & Fitch annual report below. You can navigate through the pages in the report by either clicking on the pages listed below, or by using the keyword search tool below to find specific information within the annual report.-
 1
1 -
2
-
3
-
4
-
5
-
6
-
7
-
8
-
9
-
10
-
11
-
12
-
13
-
14
-
15
-
 16
16 -
 17
17 -
 18
18 -
 19
19 -
 20
20 -
 21
21 -
 22
22 -
 23
23 -
 24
24 -
 25
25 -
 26
26 -
 27
27 -
 28
28 -
 29
29 -
 30
30 -
 31
31 -
 32
32 -
 33
33 -
 34
34 -
 35
35 -
 36
36 -
37
-
38
-
39
-
40
-
41
-
42
-
43
-
44
-
45
-
46
-
47
-
48
-
49
-
50
-
51
-
52
-
53
-
54
-
55
-
56
-
57
-
58
-
59
-
60
-
61
-
62
-
63
-
64
-
65
-
66
-
67
-
68
-
69
-
70
-
71
-
72
-
73
-
74
-
75
-
76
-
77
-
78
-
79
-
80
-
81
-
82
-
83
-
84
-
85
-
86
-
87
-
88
-
89
-
90
-
91
-
92
-
93
-
94
-
95
-
96
-
97
-
98
-
99
-
100
-
101
-
102
-
103
-
104
-
105
 |
 |
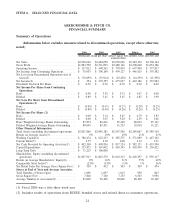
(3) Return on average assets is computed by dividing net income (including discontinued operations) by the
average asset balance (including discontinued operations).
(4) Working capital is computed by subtracting current liabilities (including discontinued operations) from
current assets (including discontinued operations).
(5) Current Ratio is computed by dividing current assets (including discontinued operations) by current
liabilities (including discontinued operations).
(6) Return on Average Shareholders’ Equity is computed by dividing net income (including discontinued
operations) by the average shareholders’ equity balance (including discontinued operations).
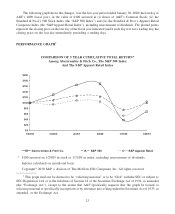
(7) A store is included in comparable store sales when it has been open as the same brand at least one year and
its square footage has not been expanded or reduced by more than 20% within the past year. Note that
Fiscal 2006 comparable store sales are compared to store sales for the comparable fifty-three weeks
ended February 4, 2006.
(8) Includes employees from RUEHL operations.
ITEM 7. MANAGEMENT’S DISCUSSION AND ANALYSIS OF FINANCIAL CONDITION AND
RESULTS OF OPERATIONS.
OVERVIEW
The Company’s fiscal year ends on the Saturday closest to January 31, typically resulting in a fifty-two
week year, but occasionally giving rise to an additional week, resulting in a fifty-three week year. A store is
included in comparable store sales when it has been open as the same brand at least one year and its square
footage has not been expanded or reduced by more than 20% within the past year.
For purposes of this “ITEM 7. MANAGEMENT’S DISCUSSION AND ANALYSIS OF FINANCIAL
CONDITION AND RESULTS OF OPERATIONS,” the fifty-two week period ended January 30, 2010 is
compared to the fifty-two week period ended January 31, 2009. Fiscal 2009 comparable store sales compare
the fifty-two week period ended January 30, 2010 to the fifty-two week period ended January 31, 2009. Fiscal
2008 comparable store sales compare the fifty-two week period ended January 31, 2009 to the fifty-two week
period ended February 2, 2008. For Fiscal 2007, the fifty-two week period ended February 2, 2008 is
compared to the fifty-three week period ended February 3, 2007.
On June 16, 2009, A&F’s Board of Directors approved the closure of the Company’s 29 RUEHL branded
stores and related direct-to-consumer operations. The determination to take this action was based on a
comprehensive review and evaluation of the performance of the RUEHL branded stores and related
direct-to-consumer operations, as well as the related real estate portfolio. The Company completed the
closure of the RUEHL branded stores and related direct-to-consumer operations during the fourth quarter of
Fiscal 2009. Accordingly, the results of operations of RUEHL are reflected in Net Loss from Discontinued
Operations on the Consolidated Statements of Operations and Comprehensive Income for all periods
presented.
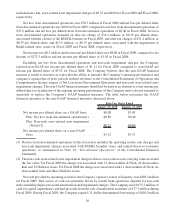
The Company had net sales of $2.929 billion for the fifty-two weeks ended January 30, 2010, down
15.9% from $3.484 billion for the fifty-two weeks ended January 31, 2009. Operating income for Fiscal 2009
was $117.9 million, which was down from $498.3 million in Fiscal 2008. Net income from continuing
operations was $79.0 million and net income per diluted share from continuing operations was $0.89 in Fiscal
2009, compared to net income from continuing operations of $308.2 million and net income per diluted share
from continuing operations of $3.45 in Fiscal 2008. Net income per diluted share from continuing operations
25