Abercrombie & Fitch 2009 Annual Report Download - page 24
Download and view the complete annual report
Please find page 24 of the 2009 Abercrombie & Fitch annual report below. You can navigate through the pages in the report by either clicking on the pages listed below, or by using the keyword search tool below to find specific information within the annual report.-
 1
1 -
2
-
3
-
4
-
5
-
6
-
7
-
8
-
9
-
10
-
11
-
12
-
13
-
 14
14 -
 15
15 -
 16
16 -
 17
17 -
 18
18 -
 19
19 -
 20
20 -
 21
21 -
 22
22 -
 23
23 -
 24
24 -
 25
25 -
 26
26 -
 27
27 -
 28
28 -
 29
29 -
 30
30 -
 31
31 -
 32
32 -
 33
33 -
 34
34 -
35
-
36
-
37
-
38
-
39
-
40
-
41
-
42
-
43
-
44
-
45
-
46
-
47
-
48
-
49
-
50
-
51
-
52
-
53
-
54
-
55
-
56
-
57
-
58
-
59
-
60
-
61
-
62
-
63
-
64
-
65
-
66
-
67
-
68
-
69
-
70
-
71
-
72
-
73
-
74
-
75
-
76
-
77
-
78
-
79
-
80
-
81
-
82
-
83
-
84
-
85
-
86
-
87
-
88
-
89
-
90
-
91
-
92
-
93
-
94
-
95
-
96
-
97
-
98
-
99
-
100
-
101
-
102
-
103
-
104
-
105
 |
 |
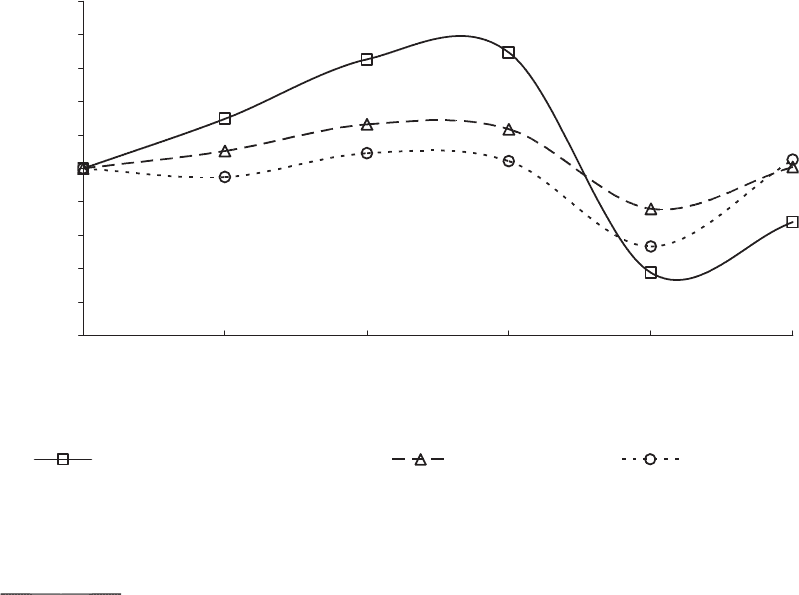
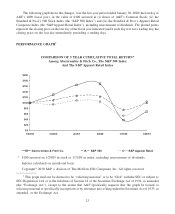
The following graph shows the changes, over the five-year period ended January 30, 2010 (the last day of
A&F’s 2009 fiscal year), in the value of $100 invested in (i) shares of A&F’s Common Stock; (ii) the
Standard & Poor’s 500 Stock Index (the “S&P 500 Index”) and (iii) the Standard & Poor’s Apparel Retail
Composite Index (the “S&P Apparel Retail Index”), including reinvestment of dividends. The plotted points
represent the closing price on the last day of the fiscal year indicated (and if such day was not a trading day, the
closing price on the last day immediately preceding a trading day).
PERFORMANCE GRAPH
1
COMPARISON OF 5 YEAR CUMULATIVE TOTAL RETURN*
Among Abercrombie & Fitch Co., The S&P 500 Index
And The S&P Apparel Retail Index
$0
$20
$40
$60
$80
$100
$120
$140
$160
$180
$200
1/29/05 1/28/06 2/3/07 2/2/08 1/31/09 1/30/10
Abercrombie & Fitch Co. S&P 500 S&P Apparel Retail
* $100 invested on 1/29/05 in stock or 1/31/05 in index, including reinvestment of dividends.
Indexes calculated on month-end basis.
Copyright·2010 S&P, a division of The McGraw-Hill Companies Inc. All rights reserved.
23
1
This graph shall not be deemed to be “soliciting material” or to be “filed” with the SEC or subject to
SEC Regulation 14A or to the liabilities of Section 18 of the Securities Exchange Act of 1934, as amended
(the “Exchange Act”), except to the extent that A&F specifically requests that the graph be treated as
soliciting material or specifically incorporates it by reference into a filing under the Securities Act of 1933, as
amended, or the Exchange Act.