Abercrombie & Fitch 2009 Annual Report Download - page 50
Download and view the complete annual report
Please find page 50 of the 2009 Abercrombie & Fitch annual report below. You can navigate through the pages in the report by either clicking on the pages listed below, or by using the keyword search tool below to find specific information within the annual report.-
 1
1 -
2
-
3
-
4
-
5
-
6
-
7
-
8
-
9
-
10
-
11
-
12
-
13
-
14
-
15
-
16
-
17
-
18
-
19
-
20
-
21
-
22
-
23
-
24
-
25
-
26
-
27
-
28
-
29
-
30
-
31
-
32
-
33
-
34
-
35
-
36
-
37
-
38
-
39
-
 40
40 -
 41
41 -
 42
42 -
 43
43 -
 44
44 -
 45
45 -
 46
46 -
 47
47 -
 48
48 -
 49
49 -
 50
50 -
 51
51 -
 52
52 -
 53
53 -
 54
54 -
 55
55 -
 56
56 -
 57
57 -
 58
58 -
 59
59 -
 60
60 -
61
-
62
-
63
-
64
-
65
-
66
-
67
-
68
-
69
-
70
-
71
-
72
-
73
-
74
-
75
-
76
-
77
-
78
-
79
-
80
-
81
-
82
-
83
-
84
-
85
-
86
-
87
-
88
-
89
-
90
-
91
-
92
-
93
-
94
-
95
-
96
-
97
-
98
-
99
-
100
-
101
-
102
-
103
-
104
-
105
 |
 |

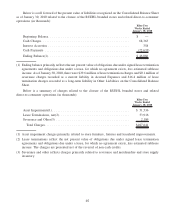
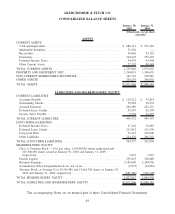
ABERCROMBIE & FITCH CO.
CONSOLIDATED BALANCE SHEETS
January 30,
2010
January 31,
2009
(Thousands, except share
amounts)
ASSETS
CURRENT ASSETS:
Cash and Equivalents . . . . . . . . . . . . . . . . . . . . . . . . . . . . . . . . . . . . . . . . . . . $ 680,113 $ 522,122
Marketable Securities . . . . . . . . . . . . . . . . . . . . . . . . . . . . . . . . . . . . . . . . . . . 32,356 —
Receivables . . . . . . . . . . . . . . . . . . . . . . . . . . . . . . . . . . . . . . . . . . . . . . . . . . 90,865 53,110
Inventories . . . . . . . . . . . . . . . . . . . . . . . . . . . . . . . . . . . . . . . . . . . . . . . . . . 310,645 372,422
Deferred Income Taxes. . . . . . . . . . . . . . . . . . . . . . . . . . . . . . . . . . . . . . . . . . 44,570 43,408
Other Current Assets . . . . . . . . . . . . . . . . . . . . . . . . . . . . . . . . . . . . . . . . . . . 77,297 80,948
TOTAL CURRENT ASSETS . . . . . . . . . . . . . . . . . . . . . . . . . . . . . . . . . . . . . . . 1,235,846 1,072,010
PROPERTY AND EQUIPMENT, NET . . . . . . . . . . . . . . . . . . . . . . . . . . . . . . . . 1,244,019 1,398,655
NON-CURRENT MARKETABLE SECURITIES . . . . . . . . . . . . . . . . . . . . . . . . . 141,794 229,081
OTHER ASSETS . . . . . . . . . . . . . . . . . . . . . . . . . . . . . . . . . . . . . . . . . . . . . . . 200,207 148,435
TOTAL ASSETS . . . . . . . . . . . . . . . . . . . . . . . . . . . . . . . . . . . . . . . . . . . . . . . $2,821,866 $2,848,181
LIABILITIES AND SHAREHOLDERS’ EQUITY
CURRENT LIABILITIES:
Accounts Payable . . . . . . . . . . . . . . . . . . . . . . . . . . . . . . . . . . . . . . . . . . . . . $ 110,212 $ 92,814
Outstanding Checks . . . . . . . . . . . . . . . . . . . . . . . . . . . . . . . . . . . . . . . . . . . . 39,922 56,939
Accrued Expenses . . . . . . . . . . . . . . . . . . . . . . . . . . . . . . . . . . . . . . . . . . . . . 246,289 241,231
Deferred Lease Credits . . . . . . . . . . . . . . . . . . . . . . . . . . . . . . . . . . . . . . . . . . 43,597 42,358
Income Taxes Payable . . . . . . . . . . . . . . . . . . . . . . . . . . . . . . . . . . . . . . . . . . 9,352 16,455
TOTAL CURRENT LIABILITIES . . . . . . . . . . . . . . . . . . . . . . . . . . . . . . . . . . . 449,372 449,797
LONG-TERM LIABILITIES:
Deferred Income Taxes. . . . . . . . . . . . . . . . . . . . . . . . . . . . . . . . . . . . . . . . . . 47,142 34,085
Deferred Lease Credits . . . . . . . . . . . . . . . . . . . . . . . . . . . . . . . . . . . . . . . . . . 212,052 211,978
Long-term Debt . . . . . . . . . . . . . . . . . . . . . . . . . . . . . . . . . . . . . . . . . . . . . . . 71,213 100,000
Other Liabilities . . . . . . . . . . . . . . . . . . . . . . . . . . . . . . . . . . . . . . . . . . . . . . 214,170 206,743
TOTAL LONG-TERM LIABILITIES . . . . . . . . . . . . . . . . . . . . . . . . . . . . . . . . . 544,577 552,806
SHAREHOLDERS’ EQUITY:
Class A Common Stock — $.01 par value: 150,000,000 shares authorized and
103,300,000 shares issued at January 30, 2010 and January 31, 2009,
respectively . . . . . . . . . . . . . . . . . . . . . . . . . . . . . . . . . . . . . . . . . . . . . . . . 1,033 1,033
Paid-In Capital . . . . . . . . . . . . . . . . . . . . . . . . . . . . . . . . . . . . . . . . . . . . . . . 339,453 328,488
Retained Earnings . . . . . . . . . . . . . . . . . . . . . . . . . . . . . . . . . . . . . . . . . . . . . 2,183,690 2,244,936
Accumulated Other Comprehensive Loss, net of tax . . . . . . . . . . . . . . . . . . . . . (8,973) (22,681)
Treasury Stock, at Average Cost 15,314,481 and 15,664,385 shares at January 30,
2010 and January 31, 2009, respectively . . . . . . . . . . . . . . . . . . . . . . . . . . . . (687,286) (706,198)
TOTAL SHAREHOLDERS’ EQUITY . . . . . . . . . . . . . . . . . . . . . . . . . . . . . . . . . 1,827,917 1,845,578
TOTAL LIABILITIES AND SHAREHOLDERS’ EQUITY . . . . . . . . . . . . . . . . . . $2,821,866 $2,848,181
The accompanying Notes are an integral part of these Consolidated Financial Statements.
49