Abercrombie & Fitch 2009 Annual Report Download - page 29
Download and view the complete annual report
Please find page 29 of the 2009 Abercrombie & Fitch annual report below. You can navigate through the pages in the report by either clicking on the pages listed below, or by using the keyword search tool below to find specific information within the annual report.-
 1
1 -
2
-
3
-
4
-
5
-
6
-
7
-
8
-
9
-
10
-
11
-
12
-
13
-
14
-
15
-
16
-
17
-
18
-
 19
19 -
 20
20 -
 21
21 -
 22
22 -
 23
23 -
 24
24 -
 25
25 -
 26
26 -
 27
27 -
 28
28 -
 29
29 -
 30
30 -
 31
31 -
 32
32 -
 33
33 -
 34
34 -
 35
35 -
 36
36 -
 37
37 -
 38
38 -
 39
39 -
40
-
41
-
42
-
43
-
44
-
45
-
46
-
47
-
48
-
49
-
50
-
51
-
52
-
53
-
54
-
55
-
56
-
57
-
58
-
59
-
60
-
61
-
62
-
63
-
64
-
65
-
66
-
67
-
68
-
69
-
70
-
71
-
72
-
73
-
74
-
75
-
76
-
77
-
78
-
79
-
80
-
81
-
82
-
83
-
84
-
85
-
86
-
87
-
88
-
89
-
90
-
91
-
92
-
93
-
94
-
95
-
96
-
97
-
98
-
99
-
100
-
101
-
102
-
103
-
104
-
105
 |
 |

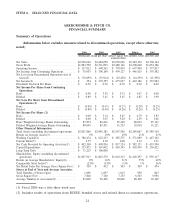
FINANCIAL SUMMARY
The following summarized financial and statistical data compares Fiscal 2009 to Fiscal 2008 and Fiscal
2008 to Fiscal 2007: 2009 2008 2007
Net sales by brand (thousands) ................................... $2,928,626 $3,484,058 $3,699,656
Abercrombie & Fitch . . . ...................................... $1,272,287 $1,531,480 $1,638,929
abercrombie kids. ........................................... $ 343,164 $ 420,518 $ 471,045
Hollister . ................................................ $1,287,241 $1,514,204 $1,589,452
Gilly Hicks** . . . ........................................... $ 25,934 $ 17,856 $ 230
Increase (decrease) in net sales from prior year ....................... (16)% (6)% 13%
Abercrombie & Fitch . . . ...................................... (17)% (7)% 8%
abercrombie kids. ........................................... (18)% (11)% 16%
Hollister . ................................................ (15)% (5)% 17%
Gilly Hicks** . . . ........................................... 45% NM NM
Decrease in comparable store sales* ............................... (23)% (13)% (1)%
Abercrombie & Fitch . . . ...................................... (19)% (8)% 0%
abercrombie kids. ........................................... (23)% (19)% 0%
Hollister . ................................................ (27)% (17)% (2)%
Net retail sales increase attributable to new and remodeled stores, and
websites ................................................. 7% 7% 14%
Net retail sales per average store (thousands) ......................... $ 2,412 $ 3,041 $ 3,546
Abercrombie & Fitch . . . ...................................... $ 3,193 $ 3,878 $ 4,073
abercrombie kids. ........................................... $ 1,453 $ 1,823 $ 2,230
Hollister . ................................................ $ 2,299 $ 2,962 $ 3,550
Net retail sales per average gross square foot ......................... $ 339 $ 432 $ 503
Abercrombie & Fitch . . . ...................................... $ 359 $ 438 $ 463
abercrombie kids. ........................................... $ 313 $ 397 $ 493
Hollister . ................................................ $ 338 $ 442 $ 531
Change in transactions per average retail store ........................ (14)% (16)% (2)%
Abercrombie & Fitch . . . ...................................... (14)% (11)% (2)%
abercrombie ............................................... (14)% (20)% (2)%
Hollister . ................................................ (16)% (18)% (4)%
Change in average retail transaction value ........................... (7)% 2% 1%
Abercrombie & Fitch . . . ...................................... (4)% 5% 5%
abercrombie ............................................... (7)% 1% 1%
Hollister . ................................................ (8)% 1% (1)%
Change in average units per retail transaction ........................ 0% 0% 2%
Abercrombie & Fitch . . . ...................................... (2)% 0% 3%
abercrombie ............................................... (1)% (2)% 2%
Hollister . ................................................ 0% (1)% 2%
Change in average unit retail sold ................................. (7)% 2% (1)%
Abercrombie & Fitch . . . ...................................... (2)% 5% 2%
abercrombie ............................................... (7)% 3% 0%
Hollister . ................................................ (8)% 1% (2)%
* A store is included in comparable store sales when it has been open as the same brand at least one year and its square
footage has not been expanded or reduced by more than 20% within the past year.
** Net sales for the fifty-two week periods ended January 30, 2010, January 31, 2009 and February 2, 2008 reflect the
activity of 16, 14 and three stores, respectively. In Fiscal 2007, all three stores opened in January 2008. Operational
data was deemed immaterial for inclusion in the table above.
28