Abercrombie & Fitch 2009 Annual Report Download - page 36
Download and view the complete annual report
Please find page 36 of the 2009 Abercrombie & Fitch annual report below. You can navigate through the pages in the report by either clicking on the pages listed below, or by using the keyword search tool below to find specific information within the annual report.-
 1
1 -
2
-
3
-
4
-
5
-
6
-
7
-
8
-
9
-
10
-
11
-
12
-
13
-
14
-
15
-
16
-
17
-
18
-
19
-
20
-
21
-
22
-
23
-
24
-
25
-
 26
26 -
 27
27 -
 28
28 -
 29
29 -
 30
30 -
 31
31 -
 32
32 -
 33
33 -
 34
34 -
 35
35 -
 36
36 -
 37
37 -
 38
38 -
 39
39 -
 40
40 -
 41
41 -
 42
42 -
 43
43 -
 44
44 -
 45
45 -
 46
46 -
47
-
48
-
49
-
50
-
51
-
52
-
53
-
54
-
55
-
56
-
57
-
58
-
59
-
60
-
61
-
62
-
63
-
64
-
65
-
66
-
67
-
68
-
69
-
70
-
71
-
72
-
73
-
74
-
75
-
76
-
77
-
78
-
79
-
80
-
81
-
82
-
83
-
84
-
85
-
86
-
87
-
88
-
89
-
90
-
91
-
92
-
93
-
94
-
95
-
96
-
97
-
98
-
99
-
100
-
101
-
102
-
103
-
104
-
105
 |
 |

A summary of the Company’s working capital (current assets less current liabilities) and capitalization at
the end of each of the last three fiscal years follows (thousands):
2009 2008 2007
Working capital ............................ $ 786,474 $ 622,213 $ 585,575
Capitalization:
Shareholders’ equity ........................ $1,827,917 $1,845,578 $1,618,313
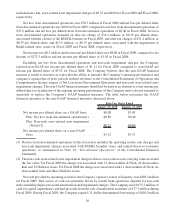
The Company considers the following to be measures of its liquidity and capital resources for the last
three fiscal years:
2009 2008 2007
Current ratio (current assets divided by current
liabilities) .................................. 2.75 2.38 2.08
Net cash provided by operating activities (thousands) .... $402,200 $490,836 $817,524
Operating Activities
Net cash provided by operating activities, the Company’s primary source of liquidity, was $402.2 million
for Fiscal 2009 compared to $490.8 million for Fiscal 2008. In Fiscal 2009, the decrease in cash provided by
operating activities was primarily driven by a reduction in net income for Fiscal 2009 compared to Fiscal
2008, adjusted for non-cash impairment charges. Operating cash flows for Fiscal 2009 included payments of
approximately $22.6 million related primarily to lease termination agreements associated with the closure of
RUEHL branded stores and related direct-to-consumer operations. Additionally, Fiscal 2009 operating cash
flows benefited from a reduction in inventory in reaction to the declining sales trend, partially offset by an
increase in lease related assets, including lease deposits and prepaid rent, associated with new flagship stores.
In Fiscal 2008, the decrease in cash provided by operating activities compared to Fiscal 2007 was driven by a
decrease in net income and incremental cash outflow associated with changes in assets and liabilities.
Investing Activities
Cash outflows from investing activities in Fiscal 2009 were used primarily for capital expenditures
related to new store construction and information technology investments. The decrease in capital expen-
ditures compared to Fiscal 2008 related primarily to a reduction in new domestic mall-based store openings in
Fiscal 2009. The Company also had cash inflows from the sale of marketable securities.
Cash outflows from investing activities in Fiscal 2008 were used for capital expenditures related
primarily to new store construction, store remodels and refreshes and information technology. Cash flows
from investing activities included sales and purchases of marketable securities.
Cash outflows from investing activities in Fiscal 2007 were used primarily for purchases of marketable
securities and trust-owned life insurance policies, and capital expenditures related primarily to new store
construction; store remodels and refreshes; the purchase of an airplane; and other various store, home office
and DC projects, partially offset by cash inflows related to proceeds from the sale of marketable securities.
35