Abercrombie & Fitch 2009 Annual Report Download - page 28
Download and view the complete annual report
Please find page 28 of the 2009 Abercrombie & Fitch annual report below. You can navigate through the pages in the report by either clicking on the pages listed below, or by using the keyword search tool below to find specific information within the annual report.-
 1
1 -
2
-
3
-
4
-
5
-
6
-
7
-
8
-
9
-
10
-
11
-
12
-
13
-
14
-
15
-
16
-
17
-
 18
18 -
 19
19 -
 20
20 -
 21
21 -
 22
22 -
 23
23 -
 24
24 -
 25
25 -
 26
26 -
 27
27 -
 28
28 -
 29
29 -
 30
30 -
 31
31 -
 32
32 -
 33
33 -
 34
34 -
 35
35 -
 36
36 -
 37
37 -
 38
38 -
39
-
40
-
41
-
42
-
43
-
44
-
45
-
46
-
47
-
48
-
49
-
50
-
51
-
52
-
53
-
54
-
55
-
56
-
57
-
58
-
59
-
60
-
61
-
62
-
63
-
64
-
65
-
66
-
67
-
68
-
69
-
70
-
71
-
72
-
73
-
74
-
75
-
76
-
77
-
78
-
79
-
80
-
81
-
82
-
83
-
84
-
85
-
86
-
87
-
88
-
89
-
90
-
91
-
92
-
93
-
94
-
95
-
96
-
97
-
98
-
99
-
100
-
101
-
102
-
103
-
104
-
105
 |
 |

under the unsecured Amended Credit Agreement and separately drew down approximately $48.0 million in
borrowings denominated in Japanese Yen, used to fund international lease and capital expenditure com-
mitments. The Company also paid dividends totaling $61.5 million during Fiscal 2009. As of January 30,
2010, the Company had $680.1 million in cash and equivalents, and outstanding debt and letters of credit of
$100.9 million.
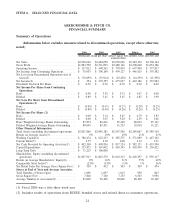
The following data represents the Company’s Consolidated Statements of Operations for the last three
fiscal years, expressed as a percentage of net sales:
2009 2008 2007
NET SALES .......................................... 100.0% 100.0% 100.0%
Cost of Goods Sold . . . .................................. 35.7 33.1 32.7
GROSS PROFIT ....................................... 64.3 66.9 67.3
Stores and Distribution Expense ............................ 48.7 41.2 36.3
Marketing, General and Administrative Expense ................ 12.1 11.6 10.2
Other Operating Income, Net .............................. (0.5) (0.3) (0.3)
OPERATING INCOME .................................. 4.0 14.3 21.1
Interest Income, Net . . .................................. (0.1) (0.3) (0.5)
Income from Continuing Operations before Income Taxes......... 4.1 14.6 21.6
Income Tax Expense from Continuing Operations ............... 1.4 5.8 8.1
Net Income from Continuing Operations...................... 2.7 8.8 13.5
Net Loss from Discontinued Operations ...................... (2.7) (1.0) (0.6)
NET INCOME ........................................ 0.0% 7.8% 12.9%
27