Abercrombie & Fitch 2009 Annual Report Download - page 32
Download and view the complete annual report
Please find page 32 of the 2009 Abercrombie & Fitch annual report below. You can navigate through the pages in the report by either clicking on the pages listed below, or by using the keyword search tool below to find specific information within the annual report.-
 1
1 -
2
-
3
-
4
-
5
-
6
-
7
-
8
-
9
-
10
-
11
-
12
-
13
-
14
-
15
-
16
-
17
-
18
-
19
-
20
-
21
-
 22
22 -
 23
23 -
 24
24 -
 25
25 -
 26
26 -
 27
27 -
 28
28 -
 29
29 -
 30
30 -
 31
31 -
 32
32 -
 33
33 -
 34
34 -
 35
35 -
 36
36 -
 37
37 -
 38
38 -
 39
39 -
 40
40 -
 41
41 -
 42
42 -
43
-
44
-
45
-
46
-
47
-
48
-
49
-
50
-
51
-
52
-
53
-
54
-
55
-
56
-
57
-
58
-
59
-
60
-
61
-
62
-
63
-
64
-
65
-
66
-
67
-
68
-
69
-
70
-
71
-
72
-
73
-
74
-
75
-
76
-
77
-
78
-
79
-
80
-
81
-
82
-
83
-
84
-
85
-
86
-
87
-
88
-
89
-
90
-
91
-
92
-
93
-
94
-
95
-
96
-
97
-
98
-
99
-
100
-
101
-
102
-
103
-
104
-
105
 |
 |

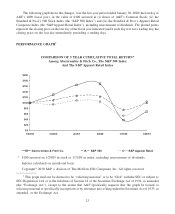
On a regional basis for Fiscal 2009, comparable store sales were down in all U.S. regions and Canada.
Comparable store sales were positive in the United Kingdom.
For Fiscal 2009, across all brands, the masculine categories continued to out-pace the feminine
categories. From a merchandise classification standpoint, across all brands, for the male business, fragrance
and sweaters were stronger performing categories, while knit tops and graphic tees were the weaker
performing categories. For the female business, woven shirts and dresses were stronger performing cate-
gories, while sweaters and knit tops were weaker categories.
Direct-to-consumer net merchandise sales in Fiscal 2009 were $249.4 million, a decrease of 5.6% from
Fiscal 2008 net merchandise sales of $264.3 million. Shipping and handling revenue was $40.7 million in
Fiscal 2009 and $42.9 million in Fiscal 2008. The direct-to-consumer business, including shipping and
handling revenue, accounted for 9.9% of total net sales in Fiscal 2009 compared to 8.8% of total net sales in
Fiscal 2008.
Gross Profit
Gross profit during Fiscal 2009 decreased to $1.884 billion from $2.331 billion in Fiscal 2008. The gross
profit rate (gross profit divided by net sales) for Fiscal 2009 was 64.3% versus 66.9% the previous year, a
decrease of 260 basis points. The decrease in the gross profit rate was primarily driven by a lower average unit
retail, partially offset by a reduction in average unit cost.
Stores and Distribution Expense
Stores and distribution expense for Fiscal 2009 was $1.426 billion compared to $1.436 billion in Fiscal
2008. For Fiscal 2009, the stores and distribution expense rate (stores and distribution expense divided by net
sales) was 48.7% compared to 41.2% for Fiscal 2008. For the fifty-two weeks ended January 30, 2010 and
January 31, 2009, stores and distribution expense included non-cash, pre-tax asset impairment charges related
to 99 stores of $33.2 million, or 1.1% of net sales, and non-cash, pre-tax asset impairment charges related to
20 stores of $8.3 million, or 0.2% of net sales, respectively. Excluding the effect of impairment charges, the
increase in the stores and distribution expense rate was primarily attributable to higher store occupancy costs,
including rent, depreciation and other occupancy costs.
Marketing, General and Administrative Expense
Marketing, general and administrative expense for Fiscal 2009 decreased 12.8% to $353.3 million
compared to $405.2 million in Fiscal 2008. The decrease in expense was related to reductions in employee
compensation and benefits, travel, and outside services. The marketing, general and administrative expense
rate (marketing, general and administrative expense divided by net sales) was 12.1% for Fiscal 2009, an
increase of 50 basis points compared to 11.6% for Fiscal 2008.
Other Operating Income, Net
Other operating income for Fiscal 2009 was $13.5 million compared to $8.8 million for Fiscal 2008. The
increase was primarily driven by gains on foreign currency transactions for Fiscal 2009 compared to losses on
foreign currency transactions for Fiscal 2008, as well as an increase in income related to gift cards for which
the Company has determined the likelihood of redemption to be remote. In Fiscal 2009, other operating
income also included a $9.2 million reduction of other-than-temporary impairments related to the Company’s
trading auction rate securities, partially offset by a reduction of the related put option of $7.7 million as
31