Abercrombie & Fitch 2009 Annual Report Download - page 51
Download and view the complete annual report
Please find page 51 of the 2009 Abercrombie & Fitch annual report below. You can navigate through the pages in the report by either clicking on the pages listed below, or by using the keyword search tool below to find specific information within the annual report.-
 1
1 -
2
-
3
-
4
-
5
-
6
-
7
-
8
-
9
-
10
-
11
-
12
-
13
-
14
-
15
-
16
-
17
-
18
-
19
-
20
-
21
-
22
-
23
-
24
-
25
-
26
-
27
-
28
-
29
-
30
-
31
-
32
-
33
-
34
-
35
-
36
-
37
-
38
-
39
-
40
-
 41
41 -
 42
42 -
 43
43 -
 44
44 -
 45
45 -
 46
46 -
 47
47 -
 48
48 -
 49
49 -
 50
50 -
 51
51 -
 52
52 -
 53
53 -
 54
54 -
 55
55 -
 56
56 -
 57
57 -
 58
58 -
 59
59 -
 60
60 -
 61
61 -
62
-
63
-
64
-
65
-
66
-
67
-
68
-
69
-
70
-
71
-
72
-
73
-
74
-
75
-
76
-
77
-
78
-
79
-
80
-
81
-
82
-
83
-
84
-
85
-
86
-
87
-
88
-
89
-
90
-
91
-
92
-
93
-
94
-
95
-
96
-
97
-
98
-
99
-
100
-
101
-
102
-
103
-
104
-
105
 |
 |

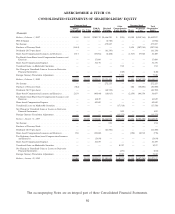
ABERCROMBIE & FITCH CO.
CONSOLIDATED STATEMENTS OF SHAREHOLDERS’ EQUITY
Shares
Outstanding Par Value
Paid-In
Capital
Retained
Earnings
Other
Comprehensive
(Loss) Income Shares
At Average
Cost
Total
Shareholders’
Equity
Common Stock Treasury Stock
(Thousands)
Balance, February 3, 2007 . . . . . . . . . . . . . . . . . . . 88,300 $1,033 $289,732 $1,646,290 $ (994) 15,000 $(530,764) $1,405,297
FIN 48 Impact . . . . . . . . . . . . . . . . . . . . . . . . . . — — — (2,786) — — — (2,786)
Net Income . . . . . . . . . . . . . . . . . . . . . . . . . . . . — — — 475,697 — — — 475,697
Purchase of Treasury Stock . . . . . . . . . . . . . . . . . . . (3,654) — — — — 3,654 (287,916) (287,916)
Dividends ($0.70 per share) . . . . . . . . . . . . . . . . . . — — — (61,330) — — — (61,330)
Share-based Compensation Issuances and Exercises . . . . . 1,513 — (19,051) (6,408) — (1,513) 57,928 32,469
Tax Benefit from Share-based Compensation Issuances and
Exercises . . . . . . . . . . . . . . . . . . . . . . . . . . . . — — 17,600 — — — — 17,600
Share-based Compensation Expense . . . . . . . . . . . . . . — — 31,170 — — — — 31,170
Unrealized Gains on Marketable Securities . . . . . . . . . . — — — — 912 — — 912
Net Change in Unrealized Gains or Losses on Derivative
Financial Instruments . . . . . . . . . . . . . . . . . . . . . — — — — (128) — — (128)
Foreign Currency Translation Adjustments . . . . . . . . . . — — — — 7,328 — — 7,328
Balance, February 2, 2008 . . . . . . . . . . . . . . . . . . . 86,159 $1,033 $319,451 $2,051,463 $ 7,118 17,141 $(760,752) $1,618,313
Net Income . . . . . . . . . . . . . . . . . . . . . . . . . . . . — — — 272,255 — — — 272,255
Purchase of Treasury Stock . . . . . . . . . . . . . . . . . . . (682) — — — — 682 (50,000) (50,000)
Dividends ($0.70 per share) . . . . . . . . . . . . . . . . . . — — — (60,769) — — — (60,769)
Share-based Compensation Issuances and Exercises . . . . . 2,159 — (49,844) (18,013) — (2,159) 104,554 36,697
Tax Benefit from Share-based Compensation Issuances and
Exercises . . . . . . . . . . . . . . . . . . . . . . . . . . . . — — 16,839 — — — — 16,839
Share-based Compensation Expense . . . . . . . . . . . . . . — — 42,042 — — — — 42,042
Unrealized Losses on Marketable Securities . . . . . . . . . — — — — (17,518) — — (17,518)
Net Change in Unrealized Gains or Losses on Derivative
Financial Instruments . . . . . . . . . . . . . . . . . . . . . — — — — 892 — — 892
Foreign Currency Translation Adjustments . . . . . . . . . . — — — — (13,173) — — (13,173)
Balance, January 31, 2009 . . . . . . . . . . . . . . . . . . . 87,636 $1,033 $328,488 $2,244,936 $(22,681) 15,664 $(706,198) $1,845,578
Net Income . . . . . . . . . . . . . . . . . . . . . . . . . . . . — — — 254 — — — 254
Purchase of Treasury Stock . . . . . . . . . . . . . . . . . . . — — — — — — — —
Dividends ($0.70 per share) . . . . . . . . . . . . . . . . . . — — — (61,500) — — — (61,500)
Share-based Compensation Issuances and Exercises . . . . . 350 — (19,690) — — (350) 18,912 (778)
Tax Deficiency from Share-based Compensation Issuances
and Exercises . . . . . . . . . . . . . . . . . . . . . . . . . — — (5,454) — — — — (5,454)
Share-based Compensation Expense . . . . . . . . . . . . . . — — 36,109 — — — — 36,109
Unrealized Gains on Marketable Securities . . . . . . . . . . — — — — 8,217 — — 8,217
Net Change in Unrealized Gains or Losses on Derivative
Financial Instruments . . . . . . . . . . . . . . . . . . . . . — — — — (451) — — (451)
Foreign Currency Translation Adjustments . . . . . . . . . . — — — — 5,942 — — 5,942
Balance, January 30, 2010 . . . . . . . . . . . . . . . . . . . 87,986 $1,033 $339,453 $2,183,690 $ (8,973) 15,314 $(687,286) $1,827,917
The accompanying Notes are an integral part of these Consolidated Financial Statements.
50