Abercrombie & Fitch 2009 Annual Report Download - page 33
Download and view the complete annual report
Please find page 33 of the 2009 Abercrombie & Fitch annual report below. You can navigate through the pages in the report by either clicking on the pages listed below, or by using the keyword search tool below to find specific information within the annual report.-
 1
1 -
2
-
3
-
4
-
5
-
6
-
7
-
8
-
9
-
10
-
11
-
12
-
13
-
14
-
15
-
16
-
17
-
18
-
19
-
20
-
21
-
22
-
 23
23 -
 24
24 -
 25
25 -
 26
26 -
 27
27 -
 28
28 -
 29
29 -
 30
30 -
 31
31 -
 32
32 -
 33
33 -
 34
34 -
 35
35 -
 36
36 -
 37
37 -
 38
38 -
 39
39 -
 40
40 -
 41
41 -
 42
42 -
 43
43 -
44
-
45
-
46
-
47
-
48
-
49
-
50
-
51
-
52
-
53
-
54
-
55
-
56
-
57
-
58
-
59
-
60
-
61
-
62
-
63
-
64
-
65
-
66
-
67
-
68
-
69
-
70
-
71
-
72
-
73
-
74
-
75
-
76
-
77
-
78
-
79
-
80
-
81
-
82
-
83
-
84
-
85
-
86
-
87
-
88
-
89
-
90
-
91
-
92
-
93
-
94
-
95
-
96
-
97
-
98
-
99
-
100
-
101
-
102
-
103
-
104
-
105
 |
 |

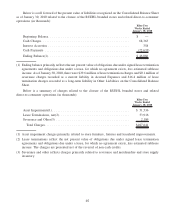
compared to an other-than-temporary impairment of $14.0 million related to the Company’s trading auction
rate securities, offset by a gain on the related put option of $12.3 million in Fiscal 2008.
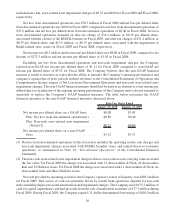
Interest Income, Net and Income Tax Expense
Fiscal 2009 interest income was $8.2 million, offset by interest expense of $6.6 million compared to
interest income of $14.8 million, offset by interest expense of $3.4 million for Fiscal 2008. The decrease in
interest income was due primarily to a lower average rate of return on investments. The increase in interest
expense was due primarily to imputed interest expense related to certain store lease transactions.
The income tax expense rate for continuing operations for Fiscal 2009 was 33.9% compared to 39.5% for
Fiscal 2008. The Fiscal 2009 rate benefited from foreign operations. Additionally, Fiscal 2008 included a
$9.9 million charge related to the execution of the Chairman and Chief Executive Officer’s new employment
agreement, which resulted in certain non-deductible amounts pursuant to Section 162(m) of the Internal
Revenue Code.
Net Loss from Discontinued Operations
The Company completed the closure of its RUEHL branded stores and related direct-to-consumer
operations in the fourth quarter of Fiscal 2009. Accordingly, the after-tax operating results appear in Net Loss
from Discontinued Operations on the Consolidated Statements of Operations and Comprehensive Income for
all fiscal years presented. Net loss from discontinued operations, net of tax, was $78.7 million and
$35.9 million for Fiscal 2009 and Fiscal 2008, respectively. Net loss from discontinued operations includes
after-tax charges of $34.2 million associated with the closure of the RUEHL business for 2009, and after-tax
charges of $31.4 million and $13.6 million associated with the impairment of RUEHL-related store assets for
Fiscal 2009 and Fiscal 2008, respectively.
Refer to Note 14, “Discontinued Operations” of the Notes to Consolidated Financial Statements for
further discussion.
Net Income and Net Income per Share
Net income for Fiscal 2009 was $0.3 million compared to $272.3 million for Fiscal 2008. Net income per
diluted share was $0.00 in Fiscal 2009 versus $3.05 in Fiscal 2008. Net income per diluted share included
$0.89 of net loss per diluted share from discontinued operations and an after-tax charge of approximately
$0.23 per diluted share associated with the impairment of store-related assets for Fiscal 2009 and $0.40 of net
loss per diluted share from discontinued operations and an after-tax charge of approximately $0.06 per diluted
share associated with the impairment of store-related assets for Fiscal 2008.
FISCAL 2008 COMPARED TO FISCAL 2007
Net Sales
Net sales for Fiscal 2008 were $3.484 billion, a decrease of 5.8% from Fiscal 2007 net sales of
$3.700 billion. The net sales decrease was attributed primarily to the 13% decrease in comparable store sales,
partially offset by a net addition of 84 stores and a 3.1% increase in direct-to-consumer business, including
shipping and handling revenue.
For Fiscal 2008, comparable store sales by brand were as follows: Abercrombie & Fitch decreased 8%;
abercrombie kids decreased 19%; and Hollister decreased 17%.
32