ADT 1999 Annual Report Download - page 66
Download and view the complete annual report
Please find page 66 of the 1999 ADT annual report below. You can navigate through the pages in the report by either clicking on the pages listed below, or by using the keyword search tool below to find specific information within the annual report.-
 1
1 -
2
-
3
-
4
-
5
-
6
-
7
-
8
-
9
-
10
-
11
-
12
-
13
-
14
-
15
-
16
-
17
-
18
-
19
-
20
-
21
-
22
-
23
-
24
-
25
-
26
-
27
-
28
-
29
-
30
-
31
-
32
-
33
-
34
-
35
-
36
-
37
-
38
-
39
-
40
-
41
-
42
-
43
-
44
-
45
-
46
-
47
-
48
-
49
-
50
-
51
-
52
-
53
-
54
-
55
-
 56
56 -
 57
57 -
 58
58 -
 59
59 -
 60
60 -
 61
61 -
 62
62 -
 63
63 -
 64
64 -
 65
65 -
 66
66 -
 67
67 -
 68
68 -
 69
69 -
 70
70 -
 71
71 -
 72
72
 |
 |

64
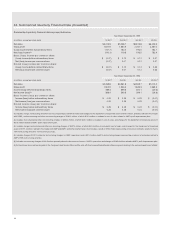
24. Summarized Quarterly Financial Data (Unaudited)
Summarized quarterly financial data is presented below.
Year Ended September 30, 1999
(in millions, except per share data) 1st Qtr.(1) 2nd Qtr.(2) 3rd Qtr.(3) 4th Qtr.
Net sales $5,213.5 $5,238.7 $5,819.8 $6,224.5
Gross profit 1,811.9 1,850.9 2,047.1 2,381.0
(Loss) income before extraordinary items (107.7) 162.0 194.0 782.7
Net (loss) income(6) (110.1) 119.5 193.5 782.4
Basic (loss) income per common share:
(Loss) income before extraordinary items $ (0.07) $ 0.10 $ 0.12 $ 0.47
Net (loss) income per common share (0.07) 0.07 0.12 0.47
Diluted (loss) income per common share:
(Loss) income before extraordinary items $ (0.07) $ 0.10 $ 0.12 $ 0.46
Net (loss) income per common share (0.07) 0.07 0.12 0.46
Year Ended September 30, 1998
(in millions, except per share data) 1st Qtr.(4) 2nd Qtr. 3rd Qtr. 4th Qtr.(5)
Net sales $4,438.8 $4,561.8 $4,948.7 $5,112.4
Gross profit 1,504.9 1,546.4 1,646.3 1,669.3
Income (loss) before extraordinary items 389.3 399.8 400.1 (20.6)
Net income (loss)(6) 388.4 399.5 399.1 (20.8)
Basic income (loss) per common share:
Income (loss) before extraordinary items $ 0.25 $ 0.26 $ 0.25 $ (0.01)
Net income (loss) per common share 0.25 0.26 0.25 (0.01)
Diluted income (loss) per common share:
Income (loss) before extraordinary items $ 0.25 $ 0.25 $ 0.24 $ (0.01)
Net income (loss) per common share 0.25 0.25 0.24 (0.01)
(1) Includes merger, restructuring and other non-recurring charges of $434.9 million and charges for the impairment of long-lived assets of $76.0 million, primarily related to the merger
with USSC, and restructuring and other non-recurring charges of $182.1 million, of which $13.3 million is included in cost of sales, related to AMP's profit improvement plan.
(2) Includes restructuring and other non-recurring charges of $262.3 million, of which $25.0 million is included in cost of sales, and charges for the impairment of long-lived assets of
$67.6 million related to AMP's profit improvement plan.
(3) Includes merger, restructuring and other non-recurring charges of $397.4 million, of which $40.6 million is included in cost of sales, and charges for the impairment of long-lived
assets of $191.4 million, related to the merger with AMP and AMP's profit improvement plan. Also includes a credit of $15.0 million representing a revision of estimates related to Tyco's
1997 restructuring and other non-recurring accruals.
(4) Includes charges of $12.0 million for restructuring charges in USSC's operations and a $21.4 million credit to restructuring charges representing a revision of estimates related to
AMP's 1996 restructuring activities.
(5) Includes non-recurring charges of $80.5 million primarily related to business exit costs in USSC's operations and charges of $185.8 million related to AMP's profit improvement plan.
(6) Extraordinary items relate principally to the Company's debt tender offers and the write off of net unamortized deferred refinancing costs relating to the early extinguishment of debt.