ADT 1999 Annual Report Download - page 42
Download and view the complete annual report
Please find page 42 of the 1999 ADT annual report below. You can navigate through the pages in the report by either clicking on the pages listed below, or by using the keyword search tool below to find specific information within the annual report.-
 1
1 -
2
-
3
-
4
-
5
-
6
-
7
-
8
-
9
-
10
-
11
-
12
-
13
-
14
-
15
-
16
-
17
-
18
-
19
-
20
-
21
-
22
-
23
-
24
-
25
-
26
-
27
-
28
-
29
-
30
-
31
-
 32
32 -
 33
33 -
 34
34 -
 35
35 -
 36
36 -
 37
37 -
 38
38 -
 39
39 -
 40
40 -
 41
41 -
 42
42 -
 43
43 -
 44
44 -
 45
45 -
 46
46 -
 47
47 -
 48
48 -
 49
49 -
 50
50 -
 51
51 -
 52
52 -
53
-
54
-
55
-
56
-
57
-
58
-
59
-
60
-
61
-
62
-
63
-
64
-
65
-
66
-
67
-
68
-
69
-
70
-
71
-
72
 |
 |

40
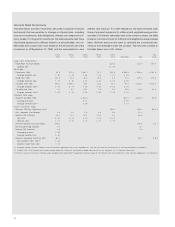
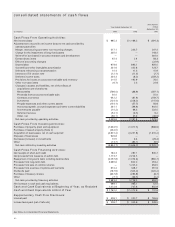
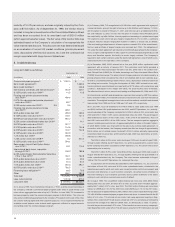
consolidated statements of cash flows
Nine Months
Year Ended September 30, Ended
September 30,
(in millions) 1999 1998 1997
Cash Flows From Operating Activities:
Net income (loss) $ 985.3 $ 1,166.2 $ (391.3)
Adjustments to reconcile net income (loss) to net cash provided by
operating activities:
Merger, restructuring and other non-recurring charges 517.1 253.7 207.4
Charge for the impairment of long-lived assets 335.0
—
148.4
Write-off of purchased in-process research and development
——
361.0
Extraordinary items 45.4 2.4 58.3
Effect of accounting changes
——
(22.9)
Depreciation 979.6 895.1 650.5
Goodwill and other intangibles amortization 331.6 242.6 123.7
Debt and refinancing cost amortization 10.4 11.3 15.9
Interest on ITS vendor note (12.1) (11.5) (7.7)
Deferred income taxes 334.3 (8.2) (259.2)
Provisions for losses on accounts receivable and inventory 211.5 192.9 76.5
Other non-cash items (6.7) 2.5 24.8
Changes in assets and liabilities, net of the effects of
acquisitions and divestitures:
Receivables (796.0) (88.9) (297.1)
Proceeds from accounts receivable sale 50.0
—
75.0
Contracts in process 642.2 (91.4) (159.7)
Inventories (124.4) (226.2) (115.6)
Prepaid expenses and other current assets (154.1) (57.7) 56.8
Accounts payable, accrued expenses and other current liabilities 361.1 (96.4) 642.5
Income taxes payable (10.2) 66.3 232.5
Deferred revenue (54.1) (6.5) 6.2
Other, net (96.1) 35.6 (46.8)
Net cash provided by operating activities 3,549.8 2,281.8 1,379.2
Cash Flows From Investing Activities:
Purchase of property, plant and equipment (1,632.5) (1,317.5) (866.6)
Purchase of leased property (Note 2) (234.0)
——
Acquisition of businesses, net of cash acquired (4,901.2) (4,251.8) (1,415.2)
Disposal of businesses 926.8
——
Decrease (increase) in investments 10.5 6.4 (29.4)
Other (13.7) (83.1) (9.5)
Net cash utilized by investing activities (5,844.1) (5,646.0) (2,320.7)
Cash Flows From Financing Activities:
Net receipts of short-term debt 162.3 287.1 945.7
Net proceeds from issuance of public debt 1,173.7 2,744.5
—
Repayment of long-term debt, including debt tenders (2,057.8) (1,074.6) (980.7)
Proceeds from long-term debt 3,665.6 802.0 253.2
Proceeds from sale of common shares
—
1,245.0 654.5
Proceeds from exercise of options and warrants 872.4 348.7 351.9
Dividends paid (187.9) (303.0) (222.2)
Purchase of treasury shares (637.8) (283.9) (6.7)
Other (7.1) (36.5) (2.2)
Net cash provided by financing activities 2,983.4 3,729.3 993.5
Net increase in cash and cash equivalents 689.1 365.1 52.0
Cash and Cash Equivalents at Beginning of Year, as Restated 1,072.9 707.8 655.8
Cash and Cash Equivalents at End of Year $ 1,762.0 $ 1,072.9 $ 707.8
Supplementary Cash Flow Disclosure:
Interest paid $ 509.1 $ 250.7 $ 186.6
Income taxes paid (net of refunds) $ 209.7 $ 345.9 $ 309.5
See Notes to Consolidated Financial Statements.