ADT 1999 Annual Report Download - page 65
Download and view the complete annual report
Please find page 65 of the 1999 ADT annual report below. You can navigate through the pages in the report by either clicking on the pages listed below, or by using the keyword search tool below to find specific information within the annual report.-
 1
1 -
2
-
3
-
4
-
5
-
6
-
7
-
8
-
9
-
10
-
11
-
12
-
13
-
14
-
15
-
16
-
17
-
18
-
19
-
20
-
21
-
22
-
23
-
24
-
25
-
26
-
27
-
28
-
29
-
30
-
31
-
32
-
33
-
34
-
35
-
36
-
37
-
38
-
39
-
40
-
41
-
42
-
43
-
44
-
45
-
46
-
47
-
48
-
49
-
50
-
51
-
52
-
53
-
54
-
 55
55 -
 56
56 -
 57
57 -
 58
58 -
 59
59 -
 60
60 -
 61
61 -
 62
62 -
 63
63 -
 64
64 -
 65
65 -
 66
66 -
 67
67 -
 68
68 -
 69
69 -
 70
70 -
 71
71 -
 72
72
 |
 |

63
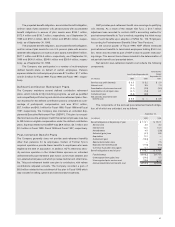
(8) Includes charges of $530.3 million related to merger, restructuring and other non-
recurring charges and $118.8 million related to the impairment of long-lived assets in con-
nection with the merger of ADT and Former Tyco.
(9) Includes charges of $256.2 million related to merger, restructuring and other non-
recurring charges and $29.6 million related to the impairment of long-lived assets in con-
nection with the Keystone merger.
(10) Excludes $234.0 million related to the purchase of leased property in connection with
the merger with USSC.
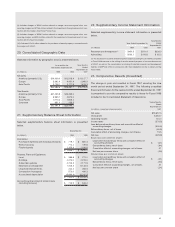
20. Consolidated Geographic Data
Selected information by geographic area is presented below.
Nine Months
As at and for the
Ended
Year Ended September 30,
September 30,
(in millions) 1999 1998 1997
Net sales:
Americas (primarily U.S.) $14,409.0 $12,518.4 $ 8,127.7
Europe 5,362.4 4,431.4 2,995.5
Asia-Pacific 2,725.1 2,111.9 1,619.3
$22,496.5 $19,061.7 $12,742.5
Total Assets:
Americas (primarily U.S.) $21,433.5 $16,465.0
Europe 6,963.7 4,874.0
Asia-Pacific 3,113.4 1,846.2
Corporate 851.0 255.5
$32,361.6 $23,440.7
21. Supplementary Balance Sheet Information
Selected supplementary balance sheet information is presented
below.
September 30,
(in millions) 1999 1998
Inventories:
Purchased materials and manufactured parts $ 719.1 $ 681.4
Work in process 774.2 729.8
Finished goods 1,355.8 1,198.8
$ 2,849.1 $ 2,610.0
Property, Plant and Equipment:
Land $ 386.8 $ 272.0
Buildings 2,414.0 2,013.0
Subscriber systems 2,703.3 2,171.5
Machinery and equipment 7,005.3 6,125.5
Leasehold improvements 224.4 264.5
Construction in progress 573.0 499.3
Accumulated depreciation (5,984.4) (5,241.5)
$ 7,322.4 $ 6,104.3
Accrued payroll and payroll related costs
(including bonuses) $ 723.5 $ 526.2
22. Supplementary Income Statement Information
Selected supplementary income statement information is presented
below.
Nine Months
Ended
Year Ended September 30,
September 30,
(in millions) 1999 1998 1997
Research and development(1) $450.5 $511.4 $326.0
Advertising $133.1 $110.8 $ 82.2
(1) The decrease in research and development expenses during Fiscal 1999 as compared
to Fiscal 1998 was due to the exiting of certain research projects of non-core businesses
at USSC, as well as the consolidation or closing of selected research and development
facilities of AMP and USSC in connection with their integration into the Company during
Fiscal 1999.
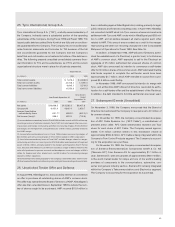
23. Comparative Results (Unaudited)
The change in year end resulted in Fiscal 1997 covering the nine
month period ended September 30, 1997. The following unaudited
financial information for the twelve months ended September 30, 1997
is presented to provide comparative results to those for Fiscal 1998
included in the Consolidated Statement of Operations.
Twelve Months
Ended
September 30,
(in millions, except per share amounts) 1997
Net sales $16,657.3
Gross profit 5,383.7
Operating income 131.0
Income taxes (379.5)
Loss before extraordinary items and cumulative effect of
accounting changes (300.5)
Extraordinary items, net of taxes (60.9)
Cumulative effect of accounting changes, net of taxes 15.5
Net loss (345.9)
Basic loss per common share:
Loss before extraordinary items and cumulative effect of
accounting changes $ (.21)
Extraordinary items, net of taxes (.04)
Cumulative effect of accounting changes, net of taxes .01
Net loss per common share (.24)
Diluted loss per common share:
Loss before extraordinary items and cumulative effect of
accounting changes $ (.21)
Extraordinary items, net of taxes (.04)
Cumulative effect of accounting changes, net of taxes .01
Net loss per common share (.24)