ADT 1999 Annual Report Download - page 34
Download and view the complete annual report
Please find page 34 of the 1999 ADT annual report below. You can navigate through the pages in the report by either clicking on the pages listed below, or by using the keyword search tool below to find specific information within the annual report.-
 1
1 -
2
-
3
-
4
-
5
-
6
-
7
-
8
-
9
-
10
-
11
-
12
-
13
-
14
-
15
-
16
-
17
-
18
-
19
-
20
-
21
-
22
-
23
-
 24
24 -
 25
25 -
 26
26 -
 27
27 -
 28
28 -
 29
29 -
 30
30 -
 31
31 -
 32
32 -
 33
33 -
 34
34 -
 35
35 -
 36
36 -
 37
37 -
 38
38 -
 39
39 -
 40
40 -
 41
41 -
 42
42 -
 43
43 -
 44
44 -
45
-
46
-
47
-
48
-
49
-
50
-
51
-
52
-
53
-
54
-
55
-
56
-
57
-
58
-
59
-
60
-
61
-
62
-
63
-
64
-
65
-
66
-
67
-
68
-
69
-
70
-
71
-
72
 |
 |

32
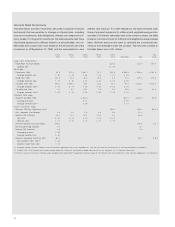
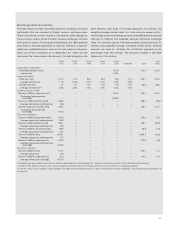
Interest Rate Sensitivity
The table below provides information about the Company’s financial
instruments that are sensitive to changes in interest rates, including
long-term investments, debt obligations, interest rate swaps and cur-
rency swaps. For long-term investments, the table presents cash flows
of principal payments (in millions) related to a subordinated, non-col-
lateralized zero coupon loan note, based on the amortized cost of the
investment as of September 30, 1999, and the associated fair value
interest rate discount. For debt obligations, the table presents cash
flows of principal repayment (in millions) and weighted average inter-
est rates. For interest rate swaps and cross-currency swaps, the table
presents notional amounts (in millions) and weighted average interest
rates. Notional amounts are used to calculate the contractual pay-
ments to be exchanged under the contract. The amounts included in
the table below are in U.S. dollars.
Fiscal Fiscal Fiscal Fiscal Fiscal Fair
2000 2001 2002 2003 2004 ThereafterTotal V alue
Long-term investment:
Fixed Rate (British Pound) 120.5 120.5 120.5
Interest rate 11.5%
Tot al debt:
Fixed rate (US$) 15.8 769.3 1,302.7 10.0 169.8 4,518.8 6,786.4 6,782.8
A verage interest rate 7.8% 6.1% 6.8% 7.1% 6.7% 6.5%
Fixed rate (Yen) 127.3 17.3 34.3 18.3 6.9 71.0 275.1 275.4
A verage interest rate 1.7% 2.3% 2.2% 2.4% 2.0% 4.5%
V ariable rate (US$) 865.0 1,984.7 44.1 22.3 10.7 87.3 3,014.1 3,015.6
A verage interest rate (1) 6.0% 5.7% 4.2% 4.4% 4.4% 3.9%
V ariable rate (Y en) 4.7 5.7 14.1 5.6 3.3 13.2 46.6 46.6
A verage interest rate (1) 2.3% 2.3% 2.3% 2.3% 2.3% 2.3%
Interest rate swap:
Fixed to variable (US$) 1,000.0 800.0 1,800.0 (66.9)
A verage p ay rate 5.7% 5.8%
A verage receive rate (1) 6.9% 6.1%
Cross-currency swap:
Receive US$/Pay Japanese Yen (2) 150.0 150.0 (22.2) (3)
Pay Japanese Y en interest 6.9 6.9 6.9 6.9 3.4 31.0
Receive US$ interest 10.1 10.1 10.1 10.1 5.0 45.4
Pay rate 4.6% 4.6% 4.6% 4.6% 4.6%
Receive rate 6.7% 6.7% 6.7% 6.7% 6.7%
Receive US$/Pay British Pound 208.2 208.2 0.0 (3)
Pay British Pound interest 6.7 6.7
Receive US$ interest 6.9 6.9
A verage p ay rate 5.5%
A verage receive rate 5.6%
Receive Japanese Yen/Pay US$ 89.7 89.7 (0.8) (3)
Pay variable (US$) rate (2) 6.1%
Receive fixed (Yen) rate 0.6%
(1) W eighted average variable interest rates are based on applicable rates as of September 30, 1999 per the terms of the contract s of the related financial instrument s.
(2) In March 1994, A M P entered into a cross-currency swap with a financial institution to hedge a portion of it s net investment in it s Jap anese subsidiary.
(3) The fair values of the cross-currency swap s included in the t able reflect the portion of the fair values of the contract s that are attribut able to the interest component of the contract s.