ADT 1999 Annual Report Download - page 58
Download and view the complete annual report
Please find page 58 of the 1999 ADT annual report below. You can navigate through the pages in the report by either clicking on the pages listed below, or by using the keyword search tool below to find specific information within the annual report.-
 1
1 -
2
-
3
-
4
-
5
-
6
-
7
-
8
-
9
-
10
-
11
-
12
-
13
-
14
-
15
-
16
-
17
-
18
-
19
-
20
-
21
-
22
-
23
-
24
-
25
-
26
-
27
-
28
-
29
-
30
-
31
-
32
-
33
-
34
-
35
-
36
-
37
-
38
-
39
-
40
-
41
-
42
-
43
-
44
-
45
-
46
-
47
-
 48
48 -
 49
49 -
 50
50 -
 51
51 -
 52
52 -
 53
53 -
 54
54 -
 55
55 -
 56
56 -
 57
57 -
 58
58 -
 59
59 -
 60
60 -
 61
61 -
 62
62 -
 63
63 -
 64
64 -
 65
65 -
 66
66 -
 67
67 -
 68
68 -
69
-
70
-
71
-
72
 |
 |

56
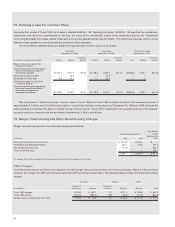
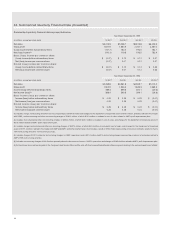
The computation of diluted income per common share in Fiscal 1999 and Fiscal 1998 excludes the effect of the assumed exercise of
approximately 3.1 million and 23.8 million stock options, respectively, that were outstanding as of September 30, 1999 and 1998, because the
effect would be anti-dilutive. The effect on diluted loss per common share in Fiscal 1997 resulting from the assumed exercise of all outstand-
ing stock options and warrants and the exchange of outstanding LYONs is anti-dilutive.
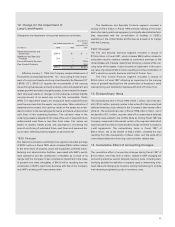
16. Merger, Restructuring and Other Non-Recurring Charges
Merger, restructuring and other non-recurring charges are as follows:
Nine Months
Ended
Year Ended September 30,
September 30,
(in millions) 1999 1998 1997
Telecommunications and Electronics $ 841.8(1) $ 164.4 $
—
Healthcare and Specialty Products 431.4 92.5 161.4
Fire and Security Services (11.5)
—
530.3
Flow Control Products
——
256.2
$ 1,261.7 $ 256.9 $ 947.9
(1) Includes $78.9 million related to the write-down of inventory which is included in cost of sales.
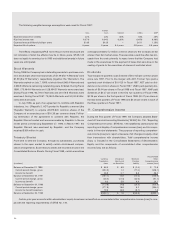
Year Ended Year Ended Nine Months Ended
September 30, 1999 September 30, 1998 September 30, 1997
Per Share Per Share Per Share
(in millions, except per share data) Income Shares Amount Income Shares Amount Loss Shares Amount
Basic Income (Loss) Per
Common Share:
Income (loss) before extraordinary
items and cumulative effect of
accounting changes $1,031.0 1,641.3 $0.63 $1,168.6 1,583.4 $0.74 $(348.5) 1,476.7 $(0.24)
Stock options and warrants
—
23.3
—
20.9
——
Exchange of LYONs debt 3.9 10.2 7.2 20.4
——
Diluted Income (Loss) Per
Common Share:
Income (loss) before extraordinary
items and cumulative effect of
accounting changes plus
assumed conversions $1,034.9 1,674.8 $0.62 $1,175.8 1,624.7 $0.72 $(348.5) 1,476.7 $(0.24)
1999 Charges
The Telecommunications and Electronics segment recorded merger, restructuring and other non-recurring charges of $841.8 million primarily
related to the merger with AMP and costs associated with AMP’s profit improvement plan. The following table provides information about these
charges:
Severance Facilities Other
Number of Number of
($ in millions) Employees Reserve Facilities Reserve Reserve Total
Fiscal 1999 charges 16,139 $ 433.7 87 $171.2 $ 236.9 $ 841.8
Fiscal 1999 activity (8,410) (359.2) (45) (75.4) (129.3) (563.9)
Ending balance at September 30, 1999 7,729 $ 74.5 42 $ 95.8 $ 107.6 $ 277.9
15. Earnings (Loss) Per Common Share
During the first quarter of Fiscal 1998, the Company adopted SFAS No. 128, “Earnings Per Share.” SFAS No. 128 specifies the computation,
presentation and disclosure requirements for earnings per share and is substantially similar to the standards issued by the International
Accounting Standards Committee entitled “International Accounting Standards Earnings Per Share.” Prior period earnings per common share
data have been restated in accordance with the provisions of this statement.
The reconciliations between basic and diluted earnings (loss) per common share are as follows: