ADT 1999 Annual Report Download - page 64
Download and view the complete annual report
Please find page 64 of the 1999 ADT annual report below. You can navigate through the pages in the report by either clicking on the pages listed below, or by using the keyword search tool below to find specific information within the annual report.-
 1
1 -
2
-
3
-
4
-
5
-
6
-
7
-
8
-
9
-
10
-
11
-
12
-
13
-
14
-
15
-
16
-
17
-
18
-
19
-
20
-
21
-
22
-
23
-
24
-
25
-
26
-
27
-
28
-
29
-
30
-
31
-
32
-
33
-
34
-
35
-
36
-
37
-
38
-
39
-
40
-
41
-
42
-
43
-
44
-
45
-
46
-
47
-
48
-
49
-
50
-
51
-
52
-
53
-
 54
54 -
 55
55 -
 56
56 -
 57
57 -
 58
58 -
 59
59 -
 60
60 -
 61
61 -
 62
62 -
 63
63 -
 64
64 -
 65
65 -
 66
66 -
 67
67 -
 68
68 -
 69
69 -
 70
70 -
 71
71 -
 72
72
 |
 |
62
For measurement purposes, in Fiscal 1999, a 8.5% composite
annual rate of increase in the per capita cost of covered health care
benefits was assumed. The rate was assumed to decrease gradually
to 4.75% by the year 2008 and remain at that level thereafter. The
health care cost trend rate assumption may have a significant effect
on the amounts reported. A one-percentage-point change in assumed
healthcare cost trend rates would have the following effects:
1-Percentage- 1-Percentage-
(in millions) Point Increase Point Decrease
Effect on total of service and interest
cost components $0.3 $(0.3)
Effect on postretirement benefit obligation 5.9 (5.2)
The combined weighted average discount rate used in determin-
ing the accumulated post-retirement benefit obligation was 7.75% at
September 30, 1999 (6.75% at September 30, 1998).
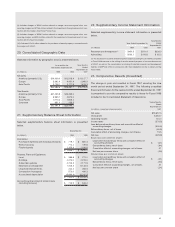
19. Consolidated Segment Data
The Company has adopted SFAS No. 131, “Disclosures about Seg-
ments of an Enterprise and Related Information,” which establishes
standards for the way companies report information about operating
segments. The Company’s reportable segments are strategic busi-
ness units that offer different products and services and are managed
separately. Segment data has been presented on a basis consistent
with how business activities are reported internally to management.
Prior year amounts have been reclassified to conform with SFAS No.
131. The primary change relates to certain Flow Control Products
business lines which were previously included in the Telecommunica-
tions and Electronics and Fire and Security Services segments. Cer-
tain corporate expenses were allocated to each operating segment’s
operating income (loss), based generally on net sales and other fac-
tors. For additional information, including a description of the products
and services included in each segment, see Note 1.
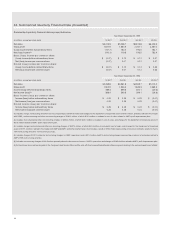
Selected information by industry segment is presented below.
Nine Months
Ended
Year Ended September 30,
September 30,
(in millions) 1999 1998 1997
Net sales:
Telecommunications and
Electronics $ 7,711.2 $ 7,067.3 $ 4,842.5
Healthcare and Specialty
Products 5,742.7 4,672.4 2,869.9
Fire and Security Services 5,534.0 4,393.5 2,892.2
Flow Control Products 3,508.6 2,928.5 2,137.9
$22,496.5 $19,061.7 $12,742.5
Nine Months
As at and for the
Ended
Year Ended September 30,
September 30,
(in millions) 1999 1998 1997
Operating income (loss):
Telecommunications and
Electronics $ 73.2(1) $ 671.4(4) $ 263.7(6)
Healthcare and Specialty
Products 878.6(2) 389.3(5) 308.1(7)
Fire and Security Services 918.5(3) 630.6 (332.5)(8)
Flow Control Products 605.5 456.9 1.3(9)
2,475.8 2,148.2 240.6
Less: Corporate expenses (122.9) (68.3) (44.8)
Goodwill amortization
expense (216.1) (131.8) (70.0)
$ 2,136.8 $ 1,948.1 $ 125.8
Total Assets:
Telecommunications and
Electronics $10,728.2 $ 6,361.9
Healthcare and Specialty
Products 8,699.7 7,256.8
Fire and Security Services 8,224.1 6,606.2
Flow Control Products 3,858.6 2,960.3
Corporate 851.0 255.5
$32,361.6 $23,440.7
Depreciation and
Amortization:
Telecommunications and
Electronics $ 468.4 $ 466.5 $ 355.2
Healthcare and Specialty
Products 287.6 262.5 130.1
Fire and Security Services 417.2 269.8 205.5
Flow Control Products 130.0 120.0 63.8
Corporate 8.0 18.9 19.6
$ 1,311.2 $ 1,137.7 $ 774.2
Capital Expenditures:
Telecommunications and
Electronics $ 488.5 $ 520.2 $ 339.2
Healthcare and Specialty
Products 235.9(10) 202.9 160.8
Fire and Security Services 746.3 491.4 304.8
Flow Control Products 135.1 92.6 58.3
Corporate 26.7 10.4 3.5
$ 1,632.5 $ 1,317.5 $ 866.6
(1) Includes merger, restructuring and other non-recurring charges of $841.8 million, of
which $78.9 million is included in cost of sales, and charges for the impairment of long-
lived assets of $259.0 million primarily related to the merger with AMP and AMP's profit
improvement plan.
(2) Includes merger, restructuring and other non-recurring charges of $434.9 million and
charges for the impairment of long-lived assets of $76.0 million, primarily related to the
merger with USSC, and a credit of $3.5 million representing a revision of estimates related
to Tyco's 1997 restructuring and other non-recurring accruals.
(3) Includes a credit of $11.5 million representing a revision of estimates related to Tyco's
1997 restructuring and other non-recurring accruals.
(4) Includes restructuring and other non-recurring charges recorded by AMP of $185.8
million related to its profit improvement plan and a credit of $21.4 million to restructur-
ing charges representing a revision of estimates related to AMP's 1996 restructuring
activities.
(5) Includes non-recurring charges of $80.5 million primarily related to business exit costs
and restructuring charges of $12.0 million related to USSC's operations.
(6) Includes a charge of $361.0 million related to the write-off of purchased research and
development costs in connection with an acquisition.
(7) Includes charges of $131.3 million related to merger, restructuring and other non-
recurring charges in connection with the Inbrand merger and $24.3 million for litigation
and other related costs and $5.8 million for restructuring charges in USSC's operations.