ADT 1999 Annual Report Download - page 52
Download and view the complete annual report
Please find page 52 of the 1999 ADT annual report below. You can navigate through the pages in the report by either clicking on the pages listed below, or by using the keyword search tool below to find specific information within the annual report.-
 1
1 -
2
-
3
-
4
-
5
-
6
-
7
-
8
-
9
-
10
-
11
-
12
-
13
-
14
-
15
-
16
-
17
-
18
-
19
-
20
-
21
-
22
-
23
-
24
-
25
-
26
-
27
-
28
-
29
-
30
-
31
-
32
-
33
-
34
-
35
-
36
-
37
-
38
-
39
-
40
-
41
-
 42
42 -
 43
43 -
 44
44 -
 45
45 -
 46
46 -
 47
47 -
 48
48 -
 49
49 -
 50
50 -
 51
51 -
 52
52 -
 53
53 -
 54
54 -
 55
55 -
 56
56 -
 57
57 -
 58
58 -
 59
59 -
 60
60 -
 61
61 -
 62
62 -
63
-
64
-
65
-
66
-
67
-
68
-
69
-
70
-
71
-
72
 |
 |
50
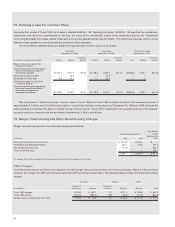
$15.7 million, $17.3 million, and $10.4 million, or 5.6%, 5.8% and 5.7%
of the weighted average balance of the receivables outstanding, dur-
ing Fiscal 1999, Fiscal 1998 and Fiscal 1997, respectively. The oper-
ating subsidiaries retain collection and administrative responsibilities
for the participating interests in the defined pool.
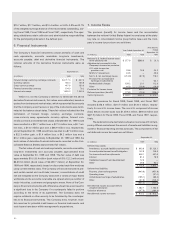
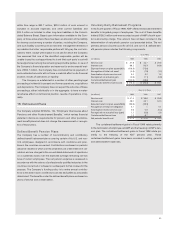
6. Financial Instruments
The Company’s financial instruments consist primarily of cash and
cash equivalents, accounts receivable, long-term investments,
accounts payable, debt and derivative financial instruments. The
notional amounts of the derivative financial instruments were as
follows:
September 30,
(in millions) 1999 1998
Forward foreign currency exchange contracts $2,717.3 $ 307.4
Currency options 160.0 153.6
Cross-currency swaps 447.9 150.0
Forward commodity contracts 104.0 79.2
Interest rate swaps 1,800.0 1,300.0
While it is not the Company’s intention to terminate the above
derivative financial instruments, fair values were estimated, based on
quotes from brokers and market rates, which represented the amounts
that the Company would receive or pay if the instruments were termi-
nated at the balance sheet dates. These fair values indicated that the
termination of forward foreign currency exchange contracts,
cross-currency swap agreements, currency options, forward com-
modity contracts and interest rate swaps at September 30, 1999 would
have resulted in a $52.7 million loss, a $27.0 million loss, a $0.7 mil-
lion loss, a $13.0 million gain and a $66.9 million loss, respectively,
and at September 30, 1998 would have resulted in a $7.6 million loss,
a $22.3 million gain, a $1.4 million loss, a $4.2 million loss and a
$13.1 million gain, respectively. At September 30, 1999 and 1998, the
book values of derivative financial instruments recorded on the Con-
solidated Balance Sheets approximated fair values.
The fair value of cash and cash equivalents, accounts receivable,
long-term investments and accounts payable approximated book
value at September 30, 1999 and 1998. The fair value of debt was
approximately $10,120.4 million (book value of $10,122.2 million) and
$6,631.8 million (book value of $6,239.7 million) at September 30,
1999 and 1998, respectively, based on discounted cash flow analyses
using current interest rates. The Company’s financial instruments pre-
sent certain market and credit risks; however, concentrations of credit
risk are mitigated as the Company deals with a variety of major banks
worldwide and its accounts receivable are spread among a number of
major industries, customers and geographic areas. None of the Com-
pany’s financial instruments with off-balance sheet risk would result in
a significant loss to the Company if a counterparty failed to perform
according to the terms of its agreement. The Company does not
require collateral or other security to be furnished by the counterpar-
ties to its financial instruments. The Company does, however, main-
tain reserves for potential credit losses on financial instruments, and
such losses have been within management’s expectations.
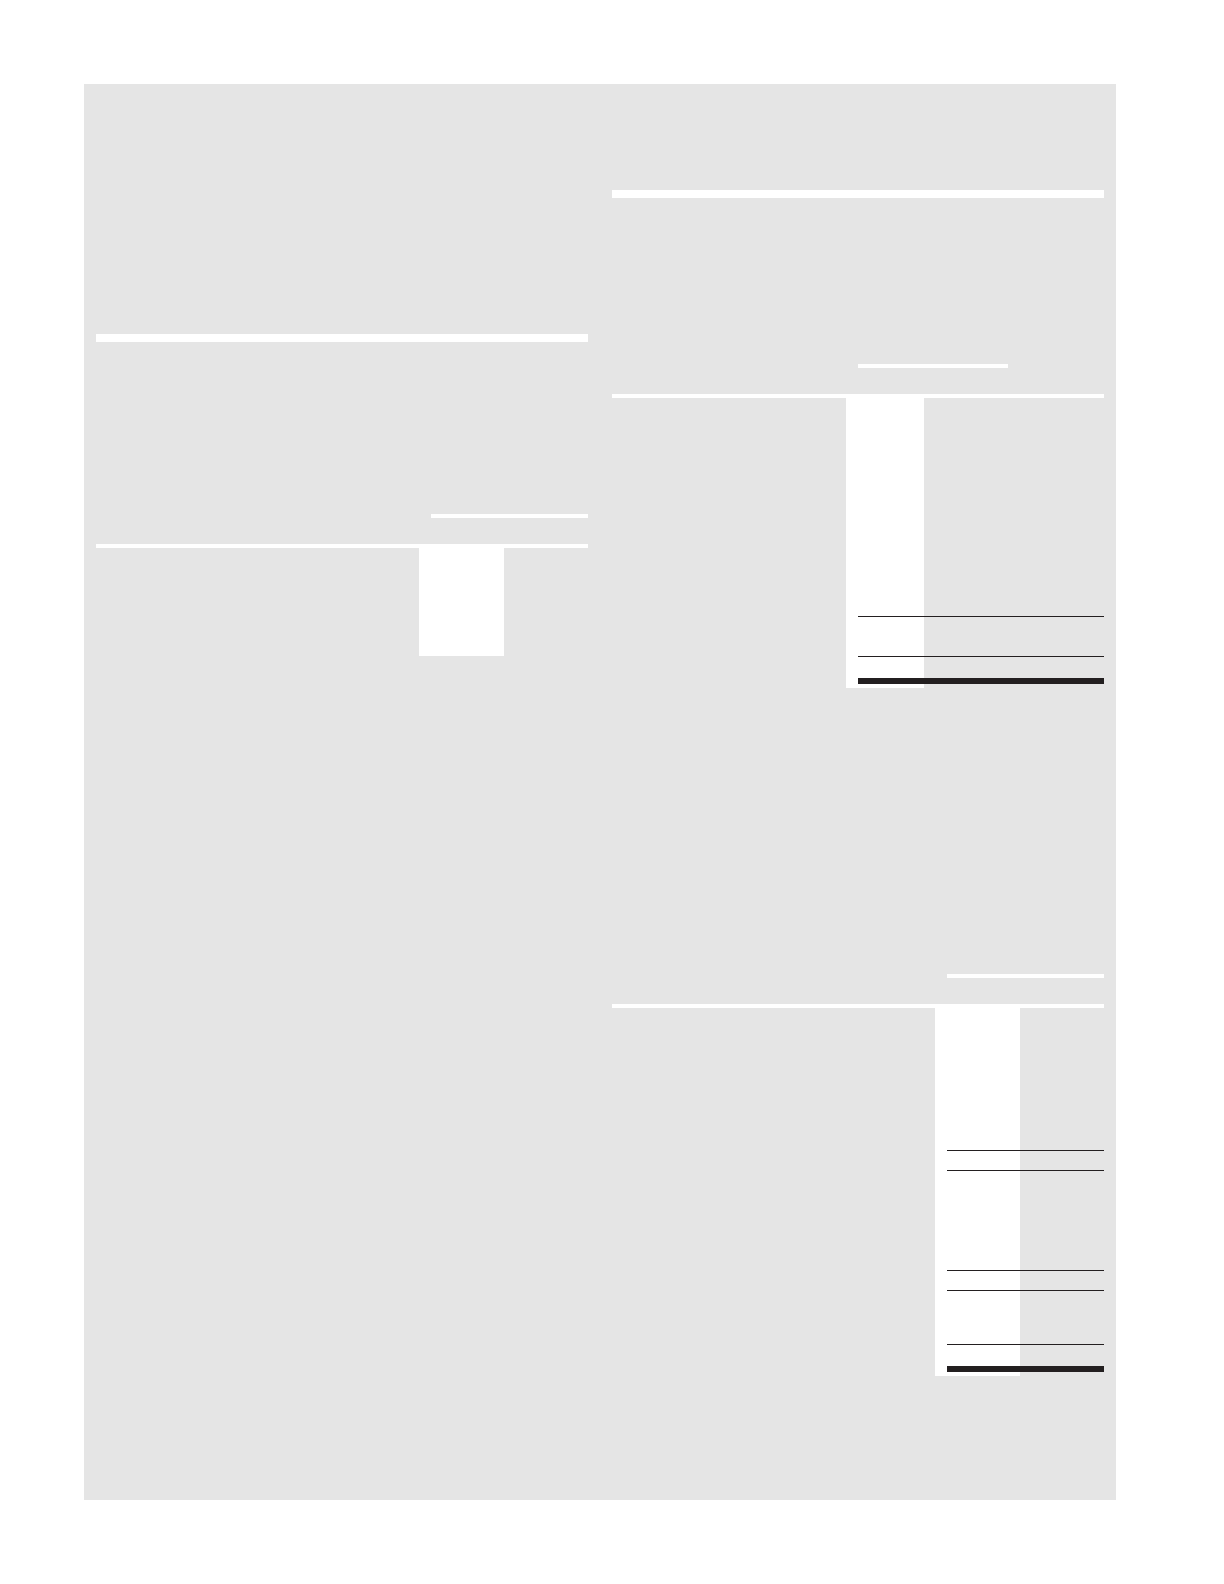
7. Income Taxes
The provision (benefit) for income taxes and the reconciliation
between the notional United States federal income taxes at the statu-
tory rate on consolidated income (loss) before taxes and the Com-
pany’s income tax provision are as follows:
Nine Months
Ended
Year Ended September 30,
September 30,
(in millions) 1999 1998 1997
Notional U.S. federal income taxes
at the statutory rate $ 577.9 $596.0 $ (0.1)
Adjustments to reconcile to the
Company’s income tax provision:
U.S. state income tax
provision, net 33.6 15.8 20.2
SFAS 121 impairment 43.5
—
49.6
Non U.S. net (earnings) losses (214.9) (67.9) 118.0
Provision for unrepatriated
earnings of subsidiaries
——
64.1
Nondeductible chargeS139.2 20.1 112.9
Other 40.9 (29.8) (16.6)
Provision for income taxes 620.2 534.2 348.1
Deferred provision (benefit) 173.9 (10.0) (225.0)
Current provision $ 446.3 $544.2 $ 573.1
The provisions for Fiscal 1999, Fiscal 1998, and Fiscal 1997
included $258.8 million, $210.5 million and $130.0 million, respec-
tively, for non-U.S. income taxes. The non-U.S. component of income
(loss) before income taxes was $1,359.4 million, $640.6 million and
$(67.5) million for Fiscal 1999, Fiscal 1998, and Fiscal 1997, respec-
tively.
The deferred income tax balance sheet accounts result from tem-
porary differences between the amount of assets and liabilities recog-
nized for financial reporting and tax purposes. The components of the
net deferred income tax asset are as follows:
September 30,
(in millions) 1999 1998
Deferred tax assets:
Inventories, accrued liabilities and reserves $ 903.6 $1,123.1
Accrued postretirement benefit obligation 102.9 146.5
Tax loss and credit carryforwards 506.1 431.6
Interest 81.2 78.9
Capitalized research and development 72.3
—
Other 49.8 94.0
1,715.9 1,874.1
Deferred tax liabilities:
Property, plant and equipment (440.6) (451.8)
Operating lease
—
(57.0)
Undistributed earnings of subsidiaries (155.1) (83.4)
Other (37.5) (129.4)
(633.2) (721.6)
Net deferred income tax asset before
valuation allowance 1,082.7 1,152.5
Valuation allowance (207.5) (180.4)
Net deferred income tax asset $ 875.2 $ 972.1