XM Radio 2010 Annual Report Download - page 94
Download and view the complete annual report
Please find page 94 of the 2010 XM Radio annual report below. You can navigate through the pages in the report by either clicking on the pages listed below, or by using the keyword search tool below to find specific information within the annual report.-
 1
1 -
2
-
3
-
4
-
5
-
6
-
7
-
8
-
9
-
10
-
11
-
12
-
13
-
14
-
15
-
16
-
17
-
18
-
19
-
20
-
21
-
22
-
23
-
24
-
25
-
26
-
27
-
28
-
29
-
30
-
31
-
32
-
33
-
34
-
35
-
36
-
37
-
38
-
39
-
40
-
41
-
42
-
43
-
44
-
45
-
46
-
47
-
48
-
49
-
50
-
51
-
52
-
53
-
54
-
55
-
56
-
57
-
58
-
59
-
60
-
61
-
62
-
63
-
64
-
65
-
66
-
67
-
68
-
69
-
70
-
71
-
72
-
73
-
74
-
75
-
76
-
77
-
78
-
79
-
80
-
81
-
82
-
83
-
 84
84 -
 85
85 -
 86
86 -
 87
87 -
 88
88 -
 89
89 -
 90
90 -
 91
91 -
 92
92 -
 93
93 -
 94
94 -
 95
95 -
 96
96 -
 97
97 -
 98
98 -
 99
99 -
 100
100 -
 101
101 -
 102
102 -
 103
103 -
 104
104 -
105
-
106
-
107
-
108
-
109
-
110
-
111
-
112
-
113
-
114
-
115
-
116
-
117
-
118
-
119
-
120
-
121
-
122
-
123
-
124
-
125
-
126
-
127
-
128
-
129
-
130
-
131
-
132
-
133
-
134
-
135
-
136
 |
 |

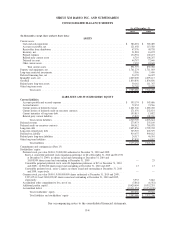
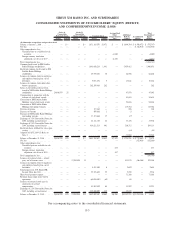
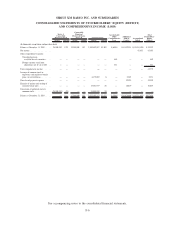
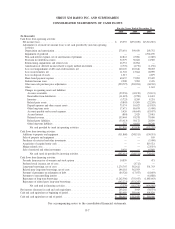
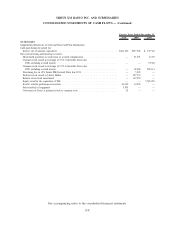
SIRIUS XM RADIO INC. AND SUBSIDIARIES
CONSOLIDATED STATEMENTS OF STOCKHOLDERS’ EQUITY (DEFICIT)
AND COMPREHENSIVE INCOME (LOSS)
Shares Amount Shares Amount Shares Amount
Accumulated
Other
Comprehensive
Loss
Additional
Paid-in
Capital
Accumulated
Deficit
Total
Stockholders’
Equity
(Deficit)
Series A
Convertible
Preferred Stock
Convertible
Perpetual
Preferred Stock,
Series B Common Stock
(In thousands, except share and per share data)
Balance at December 31, 2009 . . . . . 24,808,959 $ 25 12,500,000 $13 3,882,659,087 $3,882 $(6,581) $10,352,291 $(10,254,108) $ 95,522
Net income . . . . . . . . . . . . . . . . 43,055 43,055
Other comprehensive income:
Unrealized gain on
available-for-sale securities . . . . — — — — — — 469 — — 469
Foreign currency translation
adjustment, net of tax of $63 . . . — — — — — — 251 — — 251
Total comprehensive income . . . . . . — — — — —— — — — — 43,775
Issuance of common stock to
employees and employee benefit
plans, net of forfeitures . . . . . . . . — — — — 6,175,089 6 — 5,265 — 5,271
Share-based payment expense . . . . . — — — — — — — 52,229 — 52,229
Exercise of options and vesting of
restricted stock units . . . . . . . . . — — — — 19,551,977 20 — 10,819 — 10,839
Conversion of preferred stock to
common stock . . . . . . . . . . . . . (24,808,959) (25) — — 24,808,959 25 — — — —
Balance at December 31, 2010 . . . . . — $ — 12,500,000 $13 3,933,195,112 $3,933 $(5,861) $10,420,604 $(10,211,053) $207,636
See accompanying notes to the consolidated financial statements.
F-6