XM Radio 2010 Annual Report Download - page 72
Download and view the complete annual report
Please find page 72 of the 2010 XM Radio annual report below. You can navigate through the pages in the report by either clicking on the pages listed below, or by using the keyword search tool below to find specific information within the annual report.-
 1
1 -
2
-
3
-
4
-
5
-
6
-
7
-
8
-
9
-
10
-
11
-
12
-
13
-
14
-
15
-
16
-
17
-
18
-
19
-
20
-
21
-
22
-
23
-
24
-
25
-
26
-
27
-
28
-
29
-
30
-
31
-
32
-
33
-
34
-
35
-
36
-
37
-
38
-
39
-
40
-
41
-
42
-
43
-
44
-
45
-
46
-
47
-
48
-
49
-
50
-
51
-
52
-
53
-
54
-
55
-
56
-
57
-
58
-
59
-
60
-
61
-
 62
62 -
 63
63 -
 64
64 -
 65
65 -
 66
66 -
 67
67 -
 68
68 -
 69
69 -
 70
70 -
 71
71 -
 72
72 -
 73
73 -
 74
74 -
 75
75 -
 76
76 -
 77
77 -
 78
78 -
 79
79 -
 80
80 -
 81
81 -
 82
82 -
83
-
84
-
85
-
86
-
87
-
88
-
89
-
90
-
91
-
92
-
93
-
94
-
95
-
96
-
97
-
98
-
99
-
100
-
101
-
102
-
103
-
104
-
105
-
106
-
107
-
108
-
109
-
110
-
111
-
112
-
113
-
114
-
115
-
116
-
117
-
118
-
119
-
120
-
121
-
122
-
123
-
124
-
125
-
126
-
127
-
128
-
129
-
130
-
131
-
132
-
133
-
134
-
135
-
136
 |
 |

Liquidity and Capital Resources
Cash Flows for the Year Ended December 31, 2010 Compared with the Year Ended December 31, 2009
and Year Ended December 31, 2009 Compared with the Year Ended December 31, 2008
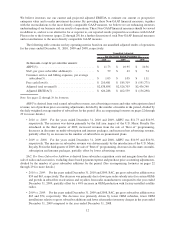
As of December 31, 2010 and 2009, we had $586,691 and $383,489, respectively, in cash and cash equivalents.
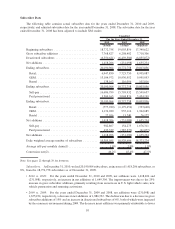
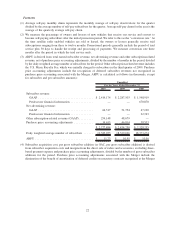
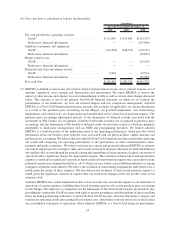
The following table presents a summary of our cash flow activity for the periods set forth below:
2010 2009 2008 2010 vs. 2009 2009 vs. 2008
For the Years Ended December 31,
Net cash provided by (used in)
operating activities............ $512,895 $ 433,830 $(152,797) $ 79,065 $ 586,627
Net cash (used in) provided by
investing activities ............ (302,414) (248,511) 728,425 (53,903) (976,936)
Net cash used in financing
activities . . ................. (7,279) (182,276) (634,002) 174,997 451,726
Net increase (decrease) in cash and
cash equivalents.............. 203,202 3,043 (58,374) 200,159 61,417
Cash and cash equivalents at
beginning of period ........... 383,489 380,446 438,820 3,043 (58,374)
Cash and cash equivalents at end of
period ..................... $586,691 $ 383,489 $ 380,446 $203,202 $ 3,043
Cash Flows Provided by (Used in) Operating Activities
Cash provided by operating activities increased by $79,065, or 18%, to $512,895 for the year ended
December 31, 2010 from $433,830 for the year ended December 31, 2009. Cash provided by operating activities
increased by $586,627, or 384%, to $433,830 for the year ended December 31, 2009 from cash used in operating
activities of $152,797 for the year ended December 31, 2008. The primary drivers of our operating cash flow growth
have been improvements in profitability and changes in operating assets and liabilities.
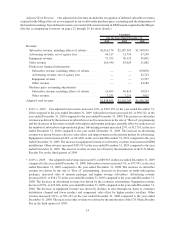
• Our net income (loss) was $43,055, ($352,038) and ($5,316,910) for the years ended December 31, 2010,
2009 and 2008, respectively. Our revenue growth has been primarily due to growth in our subscriber
revenues which increased by $126,671, or 6%, and $738,584, or 48% (including the impact of the Merger),
for the years ended December 31, 2010 and 2009, respectively. Included in the net loss for 2008 was a
$4,766,190 charge related to the impairment of goodwill.
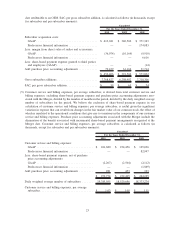
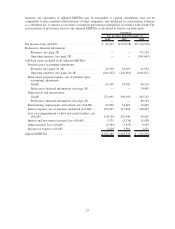
• Net non-cash adjustments to net income (loss) were $357,743, $566,524 and $5,142,961 for the years ended
December 31, 2010, 2009 and 2008, respectively. Significant components of non-cash expenses, and their
impact on cash flows from operating activities, include the following:
2010 2009 2008
For the Years Ended December 31,
Depreciation and amortization ....................... $273,691 $ 309,450 $ 203,752
Impairment of goodwill............................ — — 4,766,190
Restructuring, impairments and related costs ............ 66,731 26,964 —
Loss on extinguishment of debt and credit facilities, net .... 120,120 267,646 98,203
Share-based payment expense ....................... 60,437 73,981 87,405
Other non-cash purchase price adjustments ............. (250,727) (202,054) (68,330)
Depreciation and amortization expense is expected to increase in future periods as we recognize depreciation
expense on our recently launched satellite, XM-5, and complete the construction and launch of our FM-6 satellite.
During 2008, we recorded a goodwill impairment charge of $4,766,190, which reduced the carrying value of
goodwill from $6,601,046 to $1,834,856. There were no impairment charges recorded in 2010 and 2009.
16