XM Radio 2010 Annual Report Download - page 91
Download and view the complete annual report
Please find page 91 of the 2010 XM Radio annual report below. You can navigate through the pages in the report by either clicking on the pages listed below, or by using the keyword search tool below to find specific information within the annual report.-
 1
1 -
2
-
3
-
4
-
5
-
6
-
7
-
8
-
9
-
10
-
11
-
12
-
13
-
14
-
15
-
16
-
17
-
18
-
19
-
20
-
21
-
22
-
23
-
24
-
25
-
26
-
27
-
28
-
29
-
30
-
31
-
32
-
33
-
34
-
35
-
36
-
37
-
38
-
39
-
40
-
41
-
42
-
43
-
44
-
45
-
46
-
47
-
48
-
49
-
50
-
51
-
52
-
53
-
54
-
55
-
56
-
57
-
58
-
59
-
60
-
61
-
62
-
63
-
64
-
65
-
66
-
67
-
68
-
69
-
70
-
71
-
72
-
73
-
74
-
75
-
76
-
77
-
78
-
79
-
80
-
 81
81 -
 82
82 -
 83
83 -
 84
84 -
 85
85 -
 86
86 -
 87
87 -
 88
88 -
 89
89 -
 90
90 -
 91
91 -
 92
92 -
 93
93 -
 94
94 -
 95
95 -
 96
96 -
 97
97 -
 98
98 -
 99
99 -
 100
100 -
 101
101 -
102
-
103
-
104
-
105
-
106
-
107
-
108
-
109
-
110
-
111
-
112
-
113
-
114
-
115
-
116
-
117
-
118
-
119
-
120
-
121
-
122
-
123
-
124
-
125
-
126
-
127
-
128
-
129
-
130
-
131
-
132
-
133
-
134
-
135
-
136
 |
 |

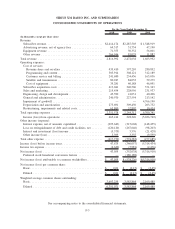
SIRIUS XM RADIO INC. AND SUBSIDIARIES
CONSOLIDATED STATEMENTS OF OPERATIONS
2010 2009 2008
For the Years Ended December 31,
(In thousands, except per share data)
Revenue:
Subscriber revenue................................... $2,414,174 $2,287,503 $ 1,548,919
Advertising revenue, net of agency fees ................... 64,517 51,754 47,190
Equipment revenue .................................. 71,355 50,352 56,001
Other revenue ...................................... 266,946 83,029 11,882
Total revenue ........................................ 2,816,992 2,472,638 1,663,992
Operating expenses:
Cost of services:
Revenue share and royalties .......................... 435,410 397,210 280,852
Programming and content ............................ 305,914 308,121 312,189
Customer service and billing ......................... 241,680 234,456 165,036
Satellite and transmission ............................ 80,947 84,033 59,279
Cost of equipment ................................. 35,281 40,188 46,091
Subscriber acquisition costs ............................ 413,041 340,506 371,343
Sales and marketing.................................. 215,454 228,956 231,937
Engineering, design and development ..................... 45,390 41,031 40,496
General and administrative ............................. 240,970 227,554 213,142
Impairment of goodwill ............................... — — 4,766,190
Depreciation and amortization .......................... 273,691 309,450 203,752
Restructuring, impairments and related costs. . .............. 63,800 32,807 10,434
Total operating expenses ................................ 2,351,578 2,244,312 6,700,741
Income (loss) from operations .......................... 465,414 228,326 (5,036,749)
Other income (expense):
Interest expense, net of amounts capitalized . . .............. (295,643) (315,668) (148,455)
Loss on extinguishment of debt and credit facilities, net ....... (120,120) (267,646) (98,203)
Interest and investment (loss) income ..................... (5,375) 5,576 (21,428)
Other income (loss) .................................. 3,399 3,355 (9,599)
Total other expense .................................... (417,739) (574,383) (277,685)
Income (loss) before income taxes ......................... 47,675 (346,057) (5,314,434)
Income tax expense .................................... (4,620) (5,981) (2,476)
Net income (loss) ..................................... 43,055 (352,038) (5,316,910)
Preferred stock beneficial conversion feature . .............. — (186,188) —
Net income (loss) attributable to common stockholders.......... $ 43,055 $ (538,226) $(5,316,910)
Net income (loss) per common share:
Basic............................................. $ 0.01 $ (0.15) $ (2.45)
Diluted ........................................... $ 0.01 $ (0.15) $ (2.45)
Weighted average common shares outstanding:
Basic............................................. 3,693,259 3,585,864 2,169,489
Diluted ........................................... 6,391,071 3,585,864 2,169,489
See accompanying notes to the consolidated financial statements.
F-3