XM Radio 2010 Annual Report Download - page 58
Download and view the complete annual report
Please find page 58 of the 2010 XM Radio annual report below. You can navigate through the pages in the report by either clicking on the pages listed below, or by using the keyword search tool below to find specific information within the annual report.-
 1
1 -
2
-
3
-
4
-
5
-
6
-
7
-
8
-
9
-
10
-
11
-
12
-
13
-
14
-
15
-
16
-
17
-
18
-
19
-
20
-
21
-
22
-
23
-
24
-
25
-
26
-
27
-
28
-
29
-
30
-
31
-
32
-
33
-
34
-
35
-
36
-
37
-
38
-
39
-
40
-
41
-
42
-
43
-
44
-
45
-
46
-
47
-
 48
48 -
 49
49 -
 50
50 -
 51
51 -
 52
52 -
 53
53 -
 54
54 -
 55
55 -
 56
56 -
 57
57 -
 58
58 -
 59
59 -
 60
60 -
 61
61 -
 62
62 -
 63
63 -
 64
64 -
 65
65 -
 66
66 -
 67
67 -
 68
68 -
69
-
70
-
71
-
72
-
73
-
74
-
75
-
76
-
77
-
78
-
79
-
80
-
81
-
82
-
83
-
84
-
85
-
86
-
87
-
88
-
89
-
90
-
91
-
92
-
93
-
94
-
95
-
96
-
97
-
98
-
99
-
100
-
101
-
102
-
103
-
104
-
105
-
106
-
107
-
108
-
109
-
110
-
111
-
112
-
113
-
114
-
115
-
116
-
117
-
118
-
119
-
120
-
121
-
122
-
123
-
124
-
125
-
126
-
127
-
128
-
129
-
130
-
131
-
132
-
133
-
134
-
135
-
136
 |
 |

Our primary source of revenue is subscription fees, with most of our customers subscribing on an annual, semi-
annual, quarterly or monthly basis. We offer discounts for prepaid and long-term subscription plans, as well as
discounts for multiple subscriptions on each platform. We also derive revenue from activation and other
subscription-related fees, the sale of advertising on select non-music channels, the direct sale of satellite radios,
components and accessories, and other ancillary services, such as our Backseat TV, data and weather services.
In certain cases, automakers include a subscription to our radio services in the sale or lease price of new and
certified pre-owned vehicles. The length of these prepaid subscriptions varies, but is typically three to twelve months.
In many cases, we receive subscription payments from automakers in advance of the activation of our service. We also
reimburse various automakers for certain costs associated with satellite radios installed in their vehicles.
We also have an interest in the satellite radio services offered in Canada. Subscribers to the SIRIUS Canada
service and the XM Canada service are not included in our subscriber count.
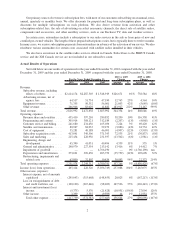
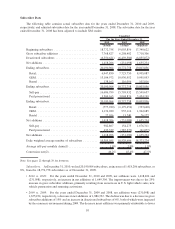
Actual Results of Operations
Set forth below are our results of operations for the year ended December 31, 2010 compared with the year ended
December 31, 2009 and the year ended December 31, 2009 compared with the year ended December 31, 2008.
2010 2009 2008 Amount % Amount %
For the Years Ended December 31,
2010 vs 2009
Change
2009 vs 2008
Change
Revenue:
Subscriber revenue, including
effects of rebates .......... $2,414,174 $2,287,503 $ 1,548,919 $126,671 6% $ 738,584 48%
Advertising revenue, net of
agency fees . . . ........... 64,517 51,754 47,190 12,763 25% 4,564 10%
Equipment revenue ........... 71,355 50,352 56,001 21,003 42% (5,649) (10)%
Other revenue . . . ........... 266,946 83,029 11,882 183,917 222% 71,147 599%
Total revenue. ................ 2,816,992 2,472,638 1,663,992 344,354 14% 808,646 49%
Operating expenses:
Revenue share and royalties .... 435,410 397,210 280,852 38,200 10% 116,358 41%
Programming and content . ..... 305,914 308,121 312,189 (2,207) (1)% (4,068) (1)%
Customer service and billing .... 241,680 234,456 165,036 7,224 3% 69,420 42%
Satellite and transmission . ..... 80,947 84,033 59,279 (3,086) (4)% 24,754 42%
Cost of equipment ........... 35,281 40,188 46,091 (4,907) (12)% (5,903) (13)%
Subscriber acquisition costs..... 413,041 340,506 371,343 72,535 21% (30,837) (8)%
Sales and marketing .......... 215,454 228,956 231,937 (13,502) (6)% (2,981) (1)%
Engineering, design and
development . . . ........... 45,390 41,031 40,496 4,359 11% 535 1%
General and administrative ..... 240,970 227,554 213,142 13,416 6% 14,412 7%
Impairment of goodwill . . ..... — — 4,766,190 — 0% (4,766,190) nm
Depreciation and amortization . . . 273,691 309,450 203,752 (35,759) (12)% 105,698 52%
Restructuring, impairments and
related costs . . . ........... 63,800 32,807 10,434 30,993 94% 22,373 214%
Total operating expenses . . . ..... 2,351,578 2,244,312 6,700,741 107,266 5% (4,456,429) (67)%
Income (loss) from operations..... 465,414 228,326 (5,036,749) 237,088 104% 5,265,075 105%
Other income (expense):
Interest expense, net of amounts
capitalized ............... (295,643) (315,668) (148,455) 20,025 6% (167,213) (113)%
Loss on extinguishment of debt
and credit facilities, net . ..... (120,120) (267,646) (98,203) 147,526 55% (169,443) (173)%
Interest and investment (loss)
income. . ................ (5,375) 5,576 (21,428) (10,951) (196)% 27,004 126%
Other income ............... 3,399 3,355 (9,599) 44 1% 12,954 135%
Total other expense ......... (417,739) (574,383) (277,685) 156,644 27% (296,698) (107)%
2