XM Radio 2010 Annual Report Download - page 84
Download and view the complete annual report
Please find page 84 of the 2010 XM Radio annual report below. You can navigate through the pages in the report by either clicking on the pages listed below, or by using the keyword search tool below to find specific information within the annual report.-
 1
1 -
2
-
3
-
4
-
5
-
6
-
7
-
8
-
9
-
10
-
11
-
12
-
13
-
14
-
15
-
16
-
17
-
18
-
19
-
20
-
21
-
22
-
23
-
24
-
25
-
26
-
27
-
28
-
29
-
30
-
31
-
32
-
33
-
34
-
35
-
36
-
37
-
38
-
39
-
40
-
41
-
42
-
43
-
44
-
45
-
46
-
47
-
48
-
49
-
50
-
51
-
52
-
53
-
54
-
55
-
56
-
57
-
58
-
59
-
60
-
61
-
62
-
63
-
64
-
65
-
66
-
67
-
68
-
69
-
70
-
71
-
72
-
73
-
 74
74 -
 75
75 -
 76
76 -
 77
77 -
 78
78 -
 79
79 -
 80
80 -
 81
81 -
 82
82 -
 83
83 -
 84
84 -
 85
85 -
 86
86 -
 87
87 -
 88
88 -
 89
89 -
 90
90 -
 91
91 -
 92
92 -
 93
93 -
 94
94 -
95
-
96
-
97
-
98
-
99
-
100
-
101
-
102
-
103
-
104
-
105
-
106
-
107
-
108
-
109
-
110
-
111
-
112
-
113
-
114
-
115
-
116
-
117
-
118
-
119
-
120
-
121
-
122
-
123
-
124
-
125
-
126
-
127
-
128
-
129
-
130
-
131
-
132
-
133
-
134
-
135
-
136
 |
 |

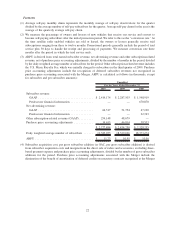
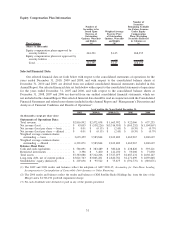
(In thousands) As Reported
Predecessor
Financial
Information
Purchase Price
Accounting
Adjustments
Allocation of
Share-Based
Payment Expense Adjusted
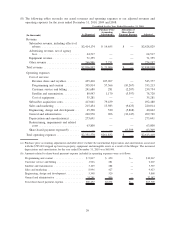
Unaudited for the Year Ended December 31, 2008
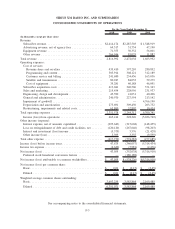
Revenue:
Subscriber revenue, including effects
of rebates .................. $1,548,919 $670,870 $ 38,533 $ — $2,258,322
Advertising revenue, net of agency
fees ....................... 47,190 22,743 — — 69,933
Equipment revenue ............. 56,001 13,397 — — 69,398
Other revenue ................. 11,882 24,184 3,021 — 39,087
Total revenue ................... $1,663,992 $731,194 $ 41,554 $ — $2,436,740
Operating expenses
Cost of services:
Revenue share and royalties ..... 280,852 166,606 30,504 — 477,962
Programming and content ...... 312,189 117,156 34,667 (17,374) 446,638
Customer service and billing .... 165,036 82,947 193 (3,981) 244,195
Satellite and transmission ....... 59,279 46,566 424 (7,084) 99,185
Cost of equipment ............ 46,091 20,013 — — 66,104
Subscriber acquisition costs ....... 371,343 174,083 31,714 (14) 577,126
Sales and marketing ............ 231,937 126,054 5,393 (21,088) 342,296
Engineering, design and
development ................ 40,496 23,045 400 (11,441) 52,500
General and administrative ....... 213,142 116,444 1,083 (63,637) 267,032
Impairment of goodwill .......... 4,766,190 — (4,766,190) — —
Depreciation and amortization(a) . . . 203,752 88,749 — — 292,501
Restructuring, impairments and
related costs ................ 10,434 — — — 10,434
Share-based payment expense(b) . . . — — — 124,619 124,619
Total operating expenses ........... $6,700,741 $961,663 $(4,661,812) $ — $3,000,592
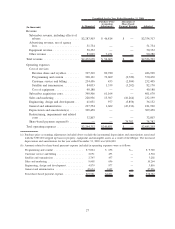
(a) Purchase price accounting adjustments included above exclude the incremental depreciation and amortization associated
with the $785,000 stepped up basis in property, equipment and intangible assets as a result of the Merger. The increased
depreciation and amortization for the year ended December 31, 2008 was $47,000.
(b) Amounts related to share-based payment expense included in operating expenses were as follows:
Programming and content. . . . . . . . . . . . . . . . $12,148 $ 4,949 $ 277 $— $ 17,374
Customer service and billing . . . . . . . . . . . . . 1,920 1,869 192 — 3,981
Satellite and transmission . . . . . . . . . . . . . . . . 4,236 2,745 103 — 7,084
Subscriber acquisition costs . . . . . . . . . . . . . . 14 — — — 14
Sales and marketing . . . . . . . . . . . . . . . . . . . 13,541 7,047 500 — 21,088
Engineering, design and development . . . . . . . 6,192 4,675 574 — 11,441
General and administrative . . . . . . . . . . . . . . . 49,354 13,200 1,083 — 63,637
Total share-based payment expense . . . . . . . . . $87,405 $34,485 $2,729 $— $124,619
28